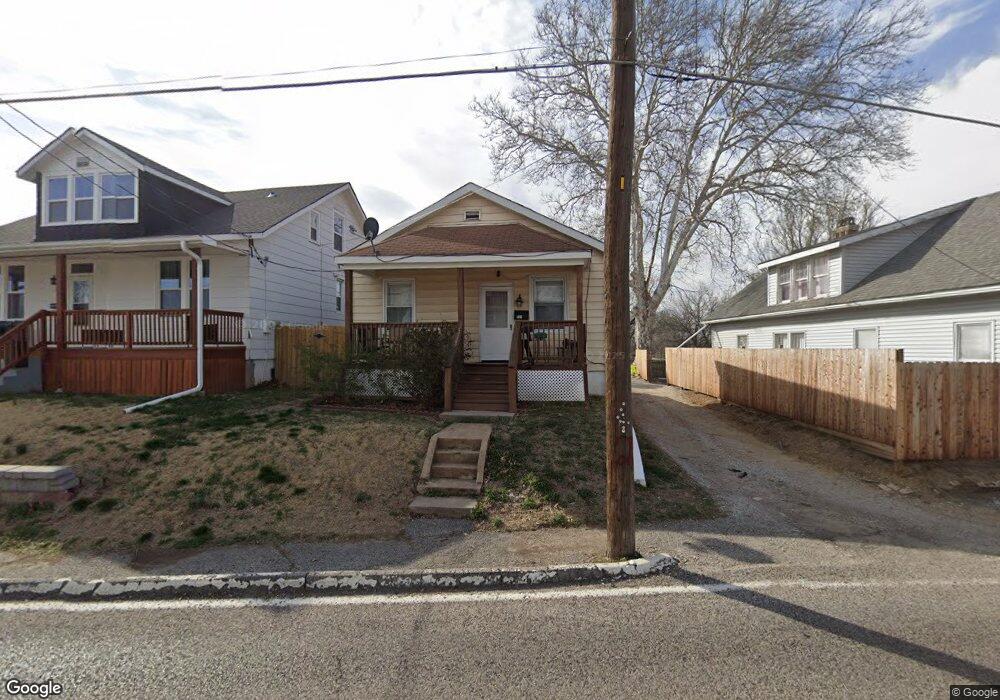
721 Military Rd Saint Louis, MO 63125
Lemay NeighborhoodEstimated Value: $41,000 - $138,000
1
Bed
1
Bath
672
Sq Ft
$148/Sq Ft
Est. Value
About This Home
This home is located at 721 Military Rd, Saint Louis, MO 63125 and is currently estimated at $99,144, approximately $147 per square foot. 721 Military Rd is a home located in St. Louis County with nearby schools including Hancock Place Elementary School, Hancock Place Middle School, and Hancock Place High School.
Ownership History
Date
Name
Owned For
Owner Type
Purchase Details
Closed on
May 23, 2013
Sold by
Baybo Melissa L and Tolie Melissa L
Bought by
Tolie Melissa L and Tolie Alexander C
Current Estimated Value
Home Financials for this Owner
Home Financials are based on the most recent Mortgage that was taken out on this home.
Original Mortgage
$47,008
Outstanding Balance
$10,112
Interest Rate
3.25%
Mortgage Type
FHA
Estimated Equity
$89,032
Purchase Details
Closed on
May 25, 2001
Sold by
Young James W
Bought by
Baybo Melissa L
Home Financials for this Owner
Home Financials are based on the most recent Mortgage that was taken out on this home.
Original Mortgage
$55,717
Interest Rate
7.07%
Mortgage Type
FHA
Purchase Details
Closed on
May 15, 2000
Sold by
Cantanzaro Jo A and Catanzaro Laura C
Bought by
Young James W
Create a Home Valuation Report for This Property
The Home Valuation Report is an in-depth analysis detailing your home's value as well as a comparison with similar homes in the area
Home Values in the Area
Average Home Value in this Area
Purchase History
| Date | Buyer | Sale Price | Title Company |
|---|---|---|---|
| Tolie Melissa L | -- | Title Partners Agency Llc | |
| Baybo Melissa L | $57,000 | -- | |
| Baybo Melissa L | -- | -- | |
| Young James W | $10,000 | -- |
Source: Public Records
Mortgage History
| Date | Status | Borrower | Loan Amount |
|---|---|---|---|
| Open | Tolie Melissa L | $47,008 | |
| Closed | Baybo Melissa L | $55,717 |
Source: Public Records
Tax History Compared to Growth
Tax History
| Year | Tax Paid | Tax Assessment Tax Assessment Total Assessment is a certain percentage of the fair market value that is determined by local assessors to be the total taxable value of land and additions on the property. | Land | Improvement |
|---|---|---|---|---|
| 2025 | $1,417 | $19,800 | $6,270 | $13,530 |
| 2024 | $1,417 | $18,160 | $4,180 | $13,980 |
| 2023 | $1,346 | $18,160 | $4,180 | $13,980 |
| 2022 | $1,101 | $13,400 | $3,630 | $9,770 |
| 2021 | $1,082 | $13,400 | $3,630 | $9,770 |
| 2020 | $1,031 | $12,180 | $4,180 | $8,000 |
| 2019 | $1,028 | $12,180 | $4,180 | $8,000 |
| 2018 | $827 | $8,490 | $3,210 | $5,280 |
| 2017 | $813 | $8,490 | $3,210 | $5,280 |
| 2016 | $757 | $7,600 | $2,220 | $5,380 |
| 2015 | $753 | $7,600 | $2,220 | $5,380 |
| 2014 | $820 | $8,820 | $2,680 | $6,140 |
Source: Public Records
Map
Nearby Homes
- 809 Military Rd
- 335 Horn Ave
- 108 Horn Ave
- 363 Hoffmeister Ave
- 302 Waller Ave
- 522 Lagro Ave
- 437 Hoffmeister Ave
- 300 Kayser Ave
- 720 Erskine Ave
- 715 Erskine Ave
- 711 Erskine Ave
- 610 Kayser Ave
- 112 Mann St
- 622 Kayser Ave
- 241 Dammert Ave
- 119 E Cartwright Ave
- 115 W Cartwright Ave
- 252 Wachtel Ave
- 235 Military Rd
- 333 Rauhut Ave