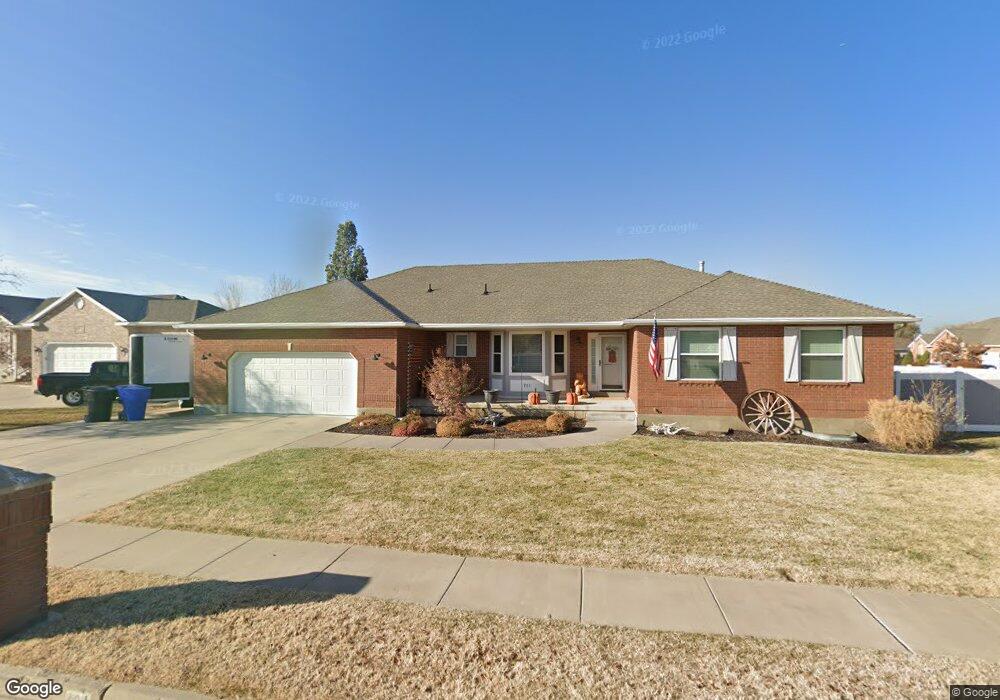
721 N 2150 W West Point, UT 84015
Estimated Value: $568,000 - $620,000
3
Beds
3
Baths
3,515
Sq Ft
$168/Sq Ft
Est. Value
About This Home
This home is located at 721 N 2150 W, West Point, UT 84015 and is currently estimated at $592,154, approximately $168 per square foot. 721 N 2150 W is a home located in Davis County with nearby schools including Lakeside School, West Point Junior High School, and Syracuse High School.
Ownership History
Date
Name
Owned For
Owner Type
Purchase Details
Closed on
Dec 4, 2013
Sold by
Packer Brent
Bought by
Packer Brent and Packer Shalamar L
Current Estimated Value
Home Financials for this Owner
Home Financials are based on the most recent Mortgage that was taken out on this home.
Original Mortgage
$253,650
Outstanding Balance
$188,028
Interest Rate
4.08%
Mortgage Type
New Conventional
Estimated Equity
$404,126
Purchase Details
Closed on
Sep 29, 2000
Sold by
Ralphs Marjorie O
Bought by
Ralphs Marjorie O
Purchase Details
Closed on
Sep 17, 1998
Sold by
Cottle Corp
Bought by
Ralphs Marjorie O
Home Financials for this Owner
Home Financials are based on the most recent Mortgage that was taken out on this home.
Original Mortgage
$70,000
Interest Rate
6.89%
Create a Home Valuation Report for This Property
The Home Valuation Report is an in-depth analysis detailing your home's value as well as a comparison with similar homes in the area
Home Values in the Area
Average Home Value in this Area
Purchase History
| Date | Buyer | Sale Price | Title Company |
|---|---|---|---|
| Packer Brent | -- | None Available | |
| Packer Brent | -- | None Available | |
| Ralphs Marjorie O | -- | -- | |
| Ralphs Marjorie O | -- | Bonneville Title Company Inc |
Source: Public Records
Mortgage History
| Date | Status | Borrower | Loan Amount |
|---|---|---|---|
| Open | Packer Brent | $253,650 | |
| Previous Owner | Ralphs Marjorie O | $70,000 |
Source: Public Records
Tax History Compared to Growth
Tax History
| Year | Tax Paid | Tax Assessment Tax Assessment Total Assessment is a certain percentage of the fair market value that is determined by local assessors to be the total taxable value of land and additions on the property. | Land | Improvement |
|---|---|---|---|---|
| 2025 | $3,169 | $297,000 | $120,404 | $176,596 |
| 2024 | $3,009 | $283,250 | $108,328 | $174,922 |
| 2023 | $2,795 | $484,000 | $139,388 | $344,612 |
| 2022 | $3,023 | $286,550 | $73,750 | $212,800 |
| 2021 | $2,758 | $391,000 | $110,465 | $280,535 |
| 2020 | $2,430 | $340,000 | $93,655 | $246,345 |
| 2019 | $2,334 | $322,000 | $90,608 | $231,392 |
| 2018 | $2,162 | $294,000 | $88,748 | $205,252 |
| 2016 | $2,005 | $143,440 | $34,390 | $109,050 |
| 2015 | $2,023 | $137,170 | $34,390 | $102,780 |
| 2014 | $1,798 | $123,615 | $34,390 | $89,225 |
| 2013 | -- | $119,088 | $37,182 | $81,906 |
Source: Public Records
Map
Nearby Homes