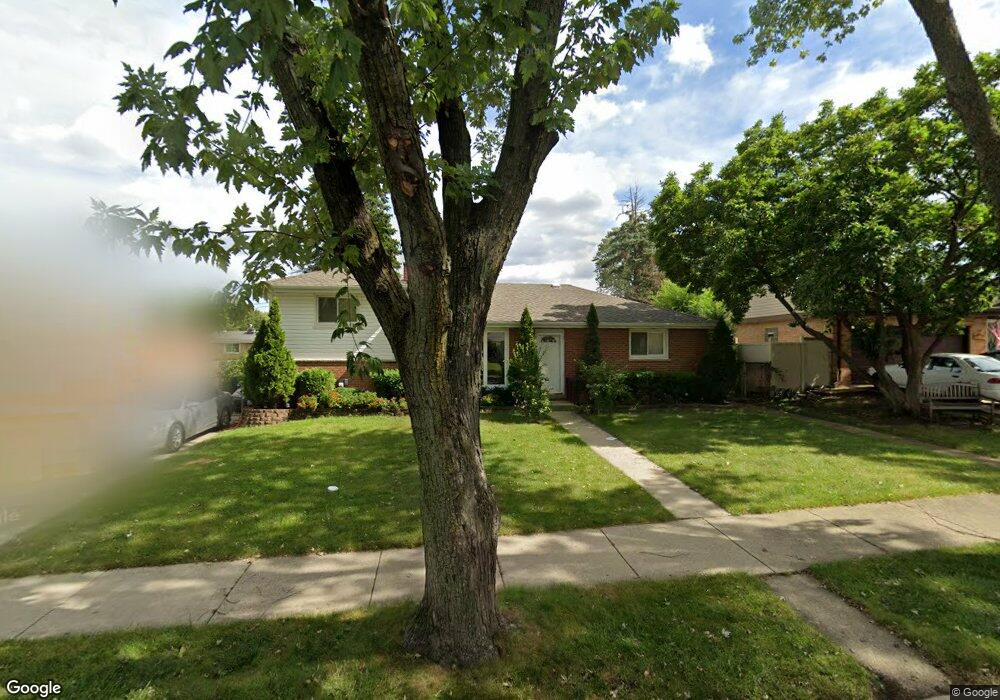
721 N Craig Place Addison, IL 60101
Estimated Value: $306,395 - $371,000
--
Bed
1
Bath
1,500
Sq Ft
$226/Sq Ft
Est. Value
About This Home
This home is located at 721 N Craig Place, Addison, IL 60101 and is currently estimated at $339,099, approximately $226 per square foot. 721 N Craig Place is a home located in DuPage County with nearby schools including Sunrise Elementary School, Lincoln Elementary School, and Indian Trail Jr High School.
Ownership History
Date
Name
Owned For
Owner Type
Purchase Details
Closed on
Nov 23, 2005
Sold by
Ramos Arturo and Ramos Julia
Bought by
Soto Uriel
Current Estimated Value
Home Financials for this Owner
Home Financials are based on the most recent Mortgage that was taken out on this home.
Original Mortgage
$196,000
Outstanding Balance
$117,051
Interest Rate
7.55%
Mortgage Type
Fannie Mae Freddie Mac
Estimated Equity
$222,048
Purchase Details
Closed on
Jan 25, 1996
Sold by
Wegner James J
Bought by
Ramos Arturo and Ramos Julia
Home Financials for this Owner
Home Financials are based on the most recent Mortgage that was taken out on this home.
Original Mortgage
$122,853
Interest Rate
7.19%
Mortgage Type
FHA
Purchase Details
Closed on
Jun 1, 1994
Sold by
Hykes Lorri A
Bought by
Wegner James J
Home Financials for this Owner
Home Financials are based on the most recent Mortgage that was taken out on this home.
Original Mortgage
$74,000
Interest Rate
8.66%
Create a Home Valuation Report for This Property
The Home Valuation Report is an in-depth analysis detailing your home's value as well as a comparison with similar homes in the area
Home Values in the Area
Average Home Value in this Area
Purchase History
| Date | Buyer | Sale Price | Title Company |
|---|---|---|---|
| Soto Uriel | $245,000 | Premier Title | |
| Ramos Arturo | $124,000 | -- | |
| Wegner James J | $99,000 | Attorneys Natl Title Network |
Source: Public Records
Mortgage History
| Date | Status | Borrower | Loan Amount |
|---|---|---|---|
| Open | Soto Uriel | $196,000 | |
| Previous Owner | Ramos Arturo | $122,853 | |
| Previous Owner | Wegner James J | $74,000 |
Source: Public Records
Tax History Compared to Growth
Tax History
| Year | Tax Paid | Tax Assessment Tax Assessment Total Assessment is a certain percentage of the fair market value that is determined by local assessors to be the total taxable value of land and additions on the property. | Land | Improvement |
|---|---|---|---|---|
| 2024 | $6,160 | $95,400 | $41,141 | $54,259 |
| 2023 | $5,867 | $87,700 | $37,820 | $49,880 |
| 2022 | $5,446 | $79,950 | $34,530 | $45,420 |
| 2021 | $5,213 | $76,580 | $33,070 | $43,510 |
| 2020 | $5,066 | $73,360 | $31,680 | $41,680 |
| 2019 | $5,026 | $70,540 | $30,460 | $40,080 |
| 2018 | $4,742 | $64,410 | $28,990 | $35,420 |
| 2017 | $4,612 | $61,560 | $27,710 | $33,850 |
| 2016 | $4,474 | $56,830 | $25,580 | $31,250 |
| 2015 | $4,347 | $52,500 | $23,630 | $28,870 |
| 2014 | $4,347 | $52,200 | $21,660 | $30,540 |
| 2013 | $4,262 | $53,260 | $22,100 | $31,160 |
Source: Public Records
Map
Nearby Homes
- 701 N Craig Place
- 641 N Highview Ave
- 138 W Janice Ln
- 661 N Briar Hill Ln Unit 5
- 465 W Dominion Dr Unit 1302
- 465 W Dominion Dr Unit 1001
- 351 S Dominion Dr
- 235 N Mill Rd Unit 115B
- 387 Masters Dr
- 329 Masters Dr
- 330 Masters Dr
- 551 N 6th Ave
- 6219 Links Dr Unit 27001
- 6213 Links Dr Unit 26001
- 6221 Links Dr Unit 27002
- 6232 Links Dr Unit 3001
- 6220 Links Dr Unit 1001
- 276 Masters Dr
- 257 Masters Dr
- 253 Masters Dr
- 729 N Craig Place
- 717 N Craig Place
- 724 N Neva Ave
- 718 N Neva Ave Unit 2
- 730 N Neva Ave
- 733 N Craig Place
- 720 N Craig Place
- 730 N Craig Place
- 726 N Craig Place
- 714 N Neva Ave
- 734 N Neva Ave
- 714 N Craig Place
- 707 N Craig Place
- 736 N Craig Place
- 708 N Neva Ave
- 740 N Neva Ave Unit 2
- 710 N Craig Place
- 745 N Craig Place Unit 2
- 723 N Neva Ave