Estimated Value: $53,000 - $115,000
3
Beds
2
Baths
2,516
Sq Ft
$32/Sq Ft
Est. Value
About This Home
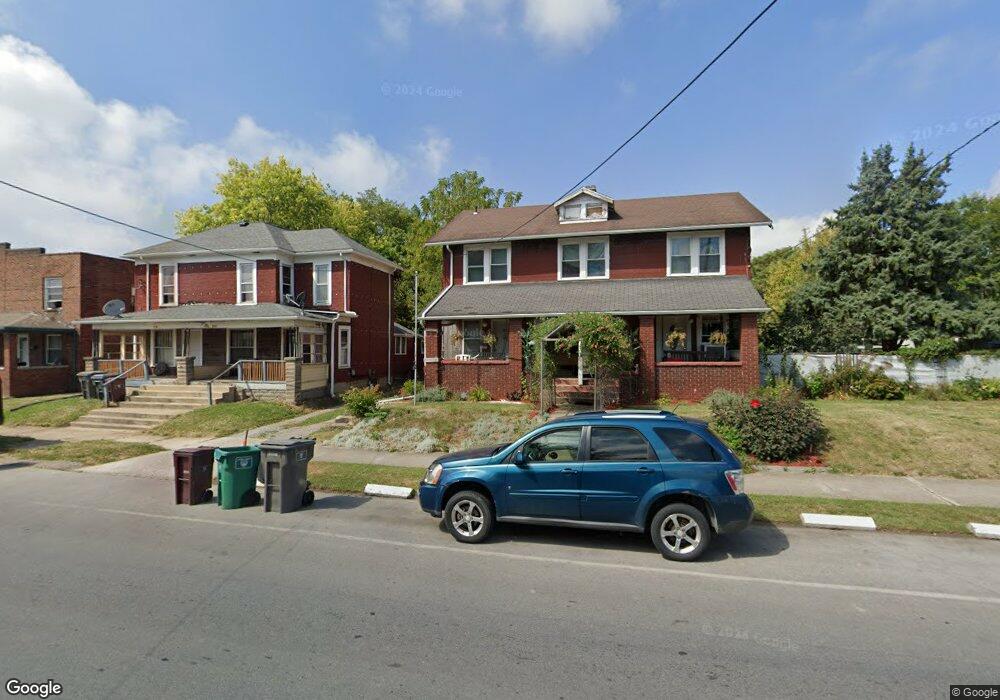
This home is located at 721 N Main St, Lima, OH 45801 and is currently estimated at $79,689, approximately $31 per square foot. 721 N Main St is a home located in Allen County with nearby schools including Independence Elementary School, Lima North Middle School, and Lima West Middle School.
Ownership History
Date
Name
Owned For
Owner Type
Purchase Details
Closed on
Oct 27, 2006
Sold by
Smith James T and Smith Dana J
Bought by
Stimmel Gregory B
Current Estimated Value
Purchase Details
Closed on
Feb 9, 1998
Sold by
Campbell Seymour E
Bought by
Meyers James and Meyers Patty
Home Financials for this Owner
Home Financials are based on the most recent Mortgage that was taken out on this home.
Original Mortgage
$20,000
Interest Rate
7.08%
Mortgage Type
New Conventional
Purchase Details
Closed on
Jul 25, 1989
Bought by
Campbell Seymoure
Create a Home Valuation Report for This Property
The Home Valuation Report is an in-depth analysis detailing your home's value as well as a comparison with similar homes in the area
Home Values in the Area
Average Home Value in this Area
Purchase History
| Date | Buyer | Sale Price | Title Company |
|---|---|---|---|
| Stimmel Gregory B | $3,000 | None Available | |
| Meyers James | $25,000 | -- | |
| Campbell Seymoure | -- | -- |
Source: Public Records
Mortgage History
| Date | Status | Borrower | Loan Amount |
|---|---|---|---|
| Previous Owner | Meyers James | $20,000 |
Source: Public Records
Tax History Compared to Growth
Tax History
| Year | Tax Paid | Tax Assessment Tax Assessment Total Assessment is a certain percentage of the fair market value that is determined by local assessors to be the total taxable value of land and additions on the property. | Land | Improvement |
|---|---|---|---|---|
| 2024 | $645 | $26,460 | $3,640 | $22,820 |
| 2023 | $531 | $20,830 | $2,870 | $17,960 |
| 2022 | $904 | $20,830 | $2,870 | $17,960 |
| 2021 | $959 | $20,830 | $2,870 | $17,960 |
| 2020 | $940 | $18,070 | $2,770 | $15,300 |
| 2019 | $940 | $18,070 | $2,770 | $15,300 |
| 2018 | $937 | $18,070 | $2,770 | $15,300 |
| 2017 | $943 | $18,070 | $2,770 | $15,300 |
| 2016 | $956 | $18,070 | $2,770 | $15,300 |
| 2015 | $591 | $18,070 | $2,770 | $15,300 |
| 2014 | $591 | $10,510 | $2,700 | $7,810 |
| 2013 | $576 | $10,510 | $2,700 | $7,810 |
Source: Public Records
Map
Nearby Homes
- 616 N Elizabeth St
- 606 N West St
- 820 N Main St
- 14 House Package
- 222 W Grand Ave
- 123 Flanders Ave
- 416 Hazel Ave
- 622 N Jefferson St
- 939 N West St
- 708 N Metcalf St
- 439 E Mckibben St
- 434 N Washington St
- 612 N Metcalf St
- 325 N McDonel St
- 627 Brice Ave
- 745 Brice Ave
- 576 Cortlandt Ave
- 631 Hazel Ave
- 638 Hazel Ave
- 648 Hazel Ave