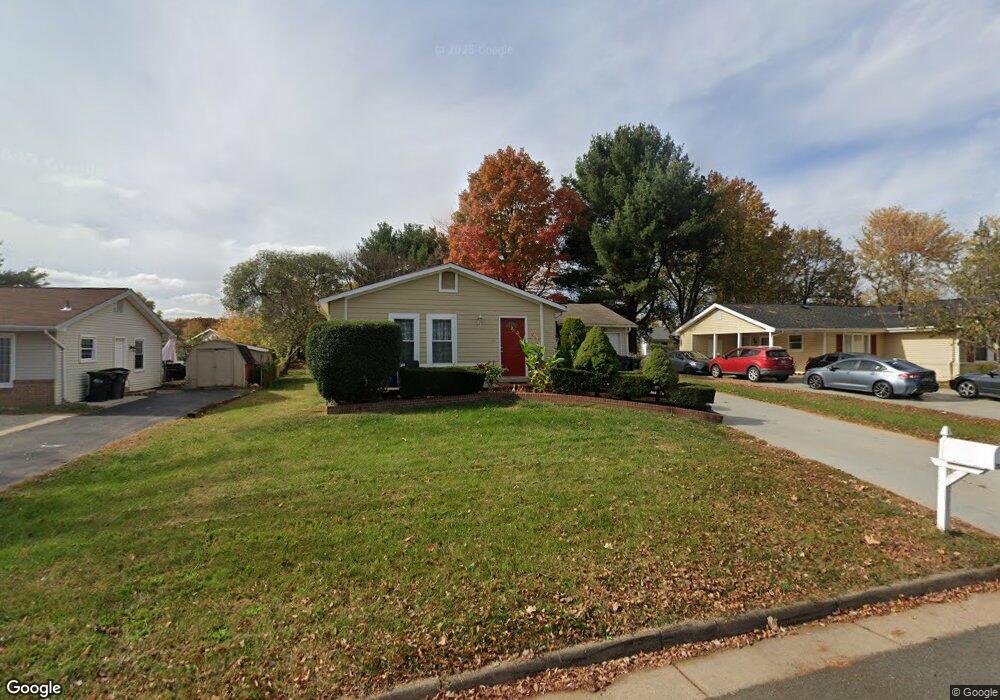
721 N Vernon St Sterling, VA 20164
Estimated Value: $561,000 - $616,000
3
Beds
2
Baths
1,488
Sq Ft
$398/Sq Ft
Est. Value
About This Home
This home is located at 721 N Vernon St, Sterling, VA 20164 and is currently estimated at $591,623, approximately $397 per square foot. 721 N Vernon St is a home located in Loudoun County with nearby schools including Sterling Elementary School, Sterling Middle School, and Park View High School.
Ownership History
Date
Name
Owned For
Owner Type
Purchase Details
Closed on
May 19, 2022
Sold by
Ap Capital Improvement Llc
Bought by
721 N Vernon Avenue Llc
Current Estimated Value
Purchase Details
Closed on
Dec 30, 2010
Sold by
Rivera Sarbelio A and Rivera Maria T
Bought by
Pereyra Juan C
Purchase Details
Closed on
Dec 28, 1998
Sold by
Anderson Billy K
Bought by
Menjivar Anival
Home Financials for this Owner
Home Financials are based on the most recent Mortgage that was taken out on this home.
Original Mortgage
$155,921
Interest Rate
6.89%
Purchase Details
Closed on
Dec 21, 1998
Sold by
Anderson Billy K
Bought by
Menjivar Anival
Home Financials for this Owner
Home Financials are based on the most recent Mortgage that was taken out on this home.
Original Mortgage
$155,921
Interest Rate
6.89%
Create a Home Valuation Report for This Property
The Home Valuation Report is an in-depth analysis detailing your home's value as well as a comparison with similar homes in the area
Home Values in the Area
Average Home Value in this Area
Purchase History
| Date | Buyer | Sale Price | Title Company |
|---|---|---|---|
| 721 N Vernon Avenue Llc | $453,560 | Purnell Timothy M | |
| Pereyra Juan C | $230,000 | -- | |
| Menjivar Anival | $156,000 | -- | |
| Menjivar Anival | $156,000 | -- |
Source: Public Records
Mortgage History
| Date | Status | Borrower | Loan Amount |
|---|---|---|---|
| Previous Owner | Menjivar Anival | $155,921 |
Source: Public Records
Tax History Compared to Growth
Tax History
| Year | Tax Paid | Tax Assessment Tax Assessment Total Assessment is a certain percentage of the fair market value that is determined by local assessors to be the total taxable value of land and additions on the property. | Land | Improvement |
|---|---|---|---|---|
| 2025 | $4,576 | $568,390 | $235,600 | $332,790 |
| 2024 | $4,542 | $525,070 | $210,600 | $314,470 |
| 2023 | $4,086 | $466,990 | $210,600 | $256,390 |
| 2022 | $4,037 | $453,560 | $190,600 | $262,960 |
| 2021 | $4,043 | $412,540 | $180,600 | $231,940 |
| 2020 | $4,207 | $406,480 | $155,600 | $250,880 |
| 2019 | $4,018 | $384,470 | $155,600 | $228,870 |
| 2018 | $3,935 | $362,710 | $140,600 | $222,110 |
| 2017 | $3,935 | $349,770 | $140,600 | $209,170 |
| 2016 | $3,816 | $333,260 | $0 | $0 |
| 2015 | $3,582 | $193,520 | $0 | $193,520 |
| 2014 | $3,510 | $181,830 | $0 | $181,830 |
Source: Public Records
Map
Nearby Homes
- 724 N Amelia St
- 805 N York Rd
- 814 N Croydon St
- 409 N Argonne Ave
- 208 Keyes Ct
- 224 W Beech Rd
- 301 N Alder Ave
- 312 E Gordon St
- 21914 Hawksbill High Cir Unit 304
- 202 E Gordon St
- 304 E Gordon St
- 46434 Rose River Terrace
- 316 Hanford Ct
- 46440 Beartown Dr
- 108 N Alder Ave
- 202 N Fir Ct
- 221 N Emory Dr Unit 4
- 1300 E Beech Rd
- 626 W Church Rd
- 203 N Lincoln Ave
- 719 N Vernon St
- 723 N Vernon St
- 724 N Watford Ct
- 717 N Vernon St
- 725 N Vernon St
- 722 N Watford Ct
- 316 W Valery Ct
- 318 W Valery Ct
- 314 W Valery Ct
- 722 N Vernon St
- 724 N Vernon St
- 726 N Watford Ct
- 727 N Vernon St
- 312 W Valery Ct
- 720 N Vernon St
- 320 W Valery Ct
- 718 N Vernon St
- 723 N Watford Ct
- 728 N Watford Ct
- 716 N Vernon St