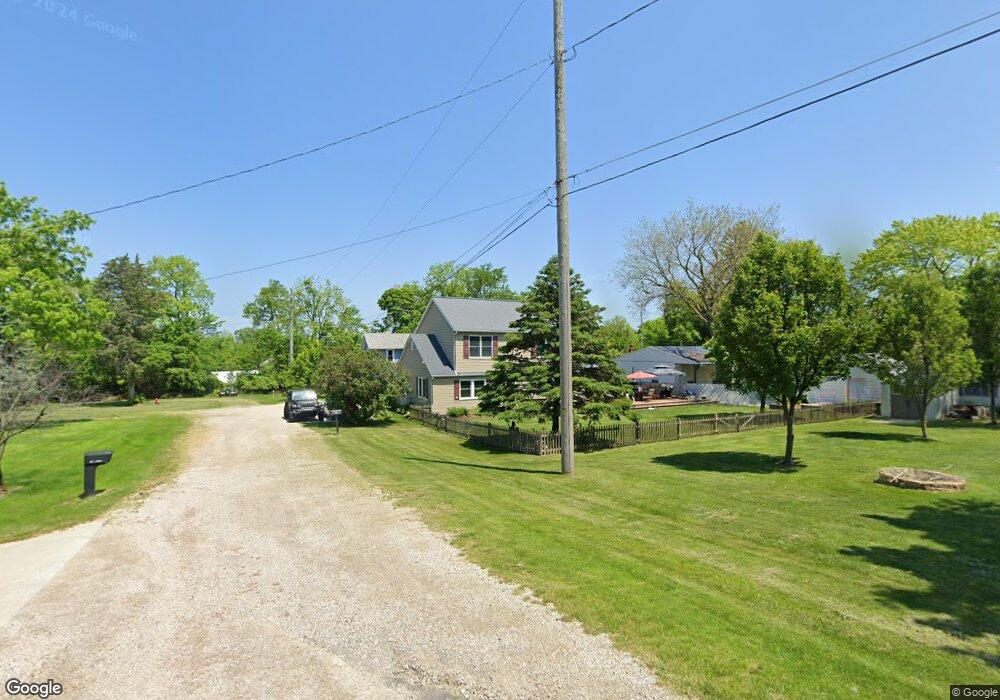
721 Peach Ave Lakeside Marblehead, OH 43440
Estimated Value: $404,000 - $746,000
4
Beds
2
Baths
2,054
Sq Ft
$285/Sq Ft
Est. Value
About This Home
This home is located at 721 Peach Ave, Lakeside Marblehead, OH 43440 and is currently estimated at $585,789, approximately $285 per square foot. 721 Peach Ave is a home located in Ottawa County with nearby schools including Danbury Middle School and Danbury High School.
Ownership History
Date
Name
Owned For
Owner Type
Purchase Details
Closed on
Feb 23, 2021
Sold by
Comings Beverly B and Comings Richard H
Bought by
Comings Michael H and Comings Jennifer M
Current Estimated Value
Home Financials for this Owner
Home Financials are based on the most recent Mortgage that was taken out on this home.
Original Mortgage
$184,000
Outstanding Balance
$164,568
Interest Rate
2.7%
Mortgage Type
New Conventional
Estimated Equity
$421,221
Purchase Details
Closed on
Apr 22, 2020
Sold by
Comings Beverly B and Comings Of Pennsylvania Llc
Bought by
Comings Bevrly B
Purchase Details
Closed on
Nov 8, 2013
Sold by
Comings Richard H and Comings Beverly B
Bought by
Comings Of Pennsylvania Llc
Purchase Details
Closed on
Mar 6, 2003
Sold by
Holzapfel Brian
Bought by
Comings Et Al Richard H
Purchase Details
Closed on
Oct 7, 1996
Sold by
Carrender Joann
Bought by
Magley Andrew B and Magley Cheri L
Home Financials for this Owner
Home Financials are based on the most recent Mortgage that was taken out on this home.
Original Mortgage
$60,400
Interest Rate
8%
Mortgage Type
New Conventional
Create a Home Valuation Report for This Property
The Home Valuation Report is an in-depth analysis detailing your home's value as well as a comparison with similar homes in the area
Home Values in the Area
Average Home Value in this Area
Purchase History
| Date | Buyer | Sale Price | Title Company |
|---|---|---|---|
| Comings Michael H | $230,000 | Hartung Title Order | |
| Comings Bevrly B | -- | None Available | |
| Comings Of Pennsylvania Llc | -- | None Available | |
| Comings Et Al Richard H | $112,000 | -- | |
| Magley Andrew B | $75,500 | -- |
Source: Public Records
Mortgage History
| Date | Status | Borrower | Loan Amount |
|---|---|---|---|
| Open | Comings Michael H | $184,000 | |
| Previous Owner | Magley Andrew B | $60,400 |
Source: Public Records
Tax History Compared to Growth
Tax History
| Year | Tax Paid | Tax Assessment Tax Assessment Total Assessment is a certain percentage of the fair market value that is determined by local assessors to be the total taxable value of land and additions on the property. | Land | Improvement |
|---|---|---|---|---|
| 2024 | $5,201 | $155,894 | $47,495 | $108,399 |
| 2023 | $5,201 | $89,293 | $23,748 | $65,545 |
| 2022 | $2,623 | $77,645 | $23,748 | $53,897 |
| 2021 | $2,689 | $77,650 | $23,750 | $53,900 |
| 2020 | $2,073 | $56,660 | $19,000 | $37,660 |
| 2019 | $1,918 | $56,660 | $19,000 | $37,660 |
| 2018 | $1,916 | $56,660 | $19,000 | $37,660 |
| 2017 | $1,786 | $52,280 | $19,000 | $33,280 |
| 2016 | $1,768 | $52,280 | $19,000 | $33,280 |
| 2015 | $1,774 | $52,280 | $19,000 | $33,280 |
| 2014 | $870 | $50,120 | $19,000 | $31,120 |
| 2013 | $1,616 | $50,120 | $19,000 | $31,120 |
Source: Public Records
Map
Nearby Homes