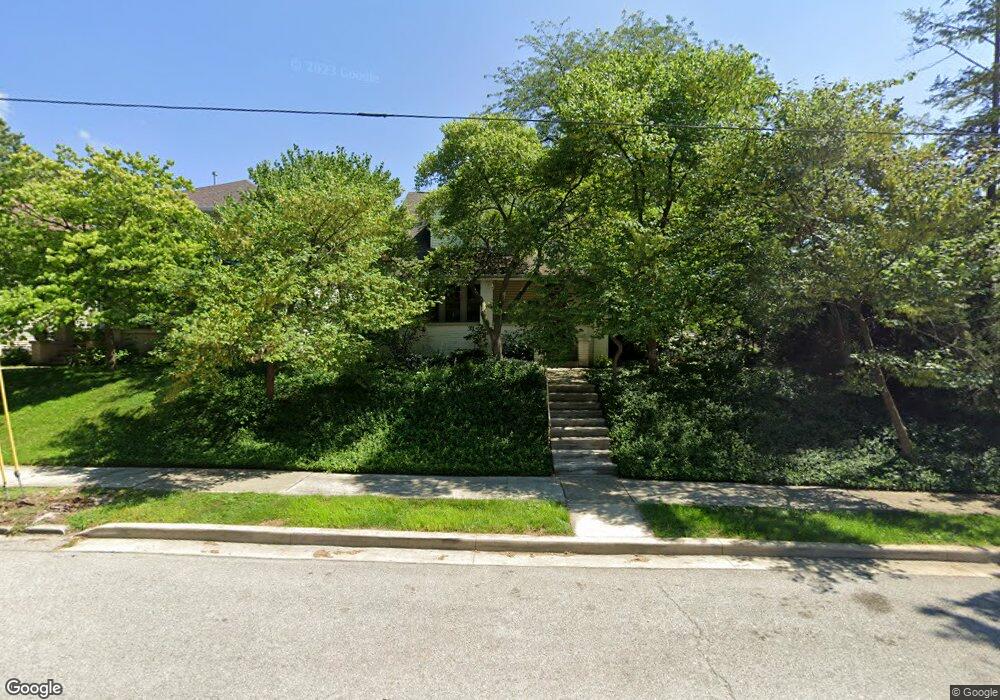
721 S 11th St Lafayette, IN 47905
Central NeighborhoodEstimated Value: $275,919 - $305,000
--
Bed
--
Bath
390
Sq Ft
$731/Sq Ft
Est. Value
About This Home
This home is located at 721 S 11th St, Lafayette, IN 47905 and is currently estimated at $285,230, approximately $731 per square foot. 721 S 11th St is a home located in Tippecanoe County with nearby schools including Oakland Elementary School, Lafayette Tecumseh Junior High School, and Sunnyside Intermediate School.
Ownership History
Date
Name
Owned For
Owner Type
Purchase Details
Closed on
Jun 8, 2006
Sold by
Clark Patricia and Hanson Patricia
Bought by
Mickelbart Michael and Mickelbart Stacey L
Current Estimated Value
Home Financials for this Owner
Home Financials are based on the most recent Mortgage that was taken out on this home.
Original Mortgage
$125,600
Outstanding Balance
$74,214
Interest Rate
6.66%
Mortgage Type
Fannie Mae Freddie Mac
Estimated Equity
$211,016
Purchase Details
Closed on
Aug 6, 2004
Sold by
Hanson Patricia and Clark Patricia A
Bought by
Hanson Patricia
Home Financials for this Owner
Home Financials are based on the most recent Mortgage that was taken out on this home.
Original Mortgage
$20,000
Interest Rate
6.1%
Mortgage Type
Credit Line Revolving
Create a Home Valuation Report for This Property
The Home Valuation Report is an in-depth analysis detailing your home's value as well as a comparison with similar homes in the area
Home Values in the Area
Average Home Value in this Area
Purchase History
| Date | Buyer | Sale Price | Title Company |
|---|---|---|---|
| Mickelbart Michael | -- | None Available | |
| Hanson Patricia | -- | -- |
Source: Public Records
Mortgage History
| Date | Status | Borrower | Loan Amount |
|---|---|---|---|
| Open | Mickelbart Michael | $125,600 | |
| Previous Owner | Hanson Patricia | $20,000 |
Source: Public Records
Tax History Compared to Growth
Tax History
| Year | Tax Paid | Tax Assessment Tax Assessment Total Assessment is a certain percentage of the fair market value that is determined by local assessors to be the total taxable value of land and additions on the property. | Land | Improvement |
|---|---|---|---|---|
| 2024 | $2,018 | $204,600 | $26,000 | $178,600 |
| 2023 | $1,878 | $194,300 | $26,000 | $168,300 |
| 2022 | $1,670 | $167,000 | $26,000 | $141,000 |
| 2021 | $1,435 | $143,500 | $26,000 | $117,500 |
| 2020 | $1,235 | $131,000 | $26,000 | $105,000 |
| 2019 | $1,148 | $126,000 | $25,000 | $101,000 |
| 2018 | $1,070 | $120,600 | $25,000 | $95,600 |
| 2017 | $995 | $116,500 | $25,000 | $91,500 |
| 2016 | $964 | $116,000 | $26,000 | $90,000 |
| 2014 | $832 | $108,000 | $26,000 | $82,000 |
| 2013 | $807 | $107,100 | $26,000 | $81,100 |
Source: Public Records
Map
Nearby Homes
- 802 S 12th St
- 804 S 10th St
- 619 S 10th St
- 1406 Virginia St
- 1204 Central St
- 701 Kossuth St
- 1501 Franklin St
- 1111 S 14th St
- 1214 King St
- 900 King St
- 1226 Sinton Ave
- 1310 Sinton Ave
- 1207 Digby Dr
- 1318 Sinton Ave
- 1622 Perdue St
- 815 S 19th St
- 207 S 9th St
- 1334 El Prado Ave
- 602 Cherokee Ave
- 1108 Potomac Ave