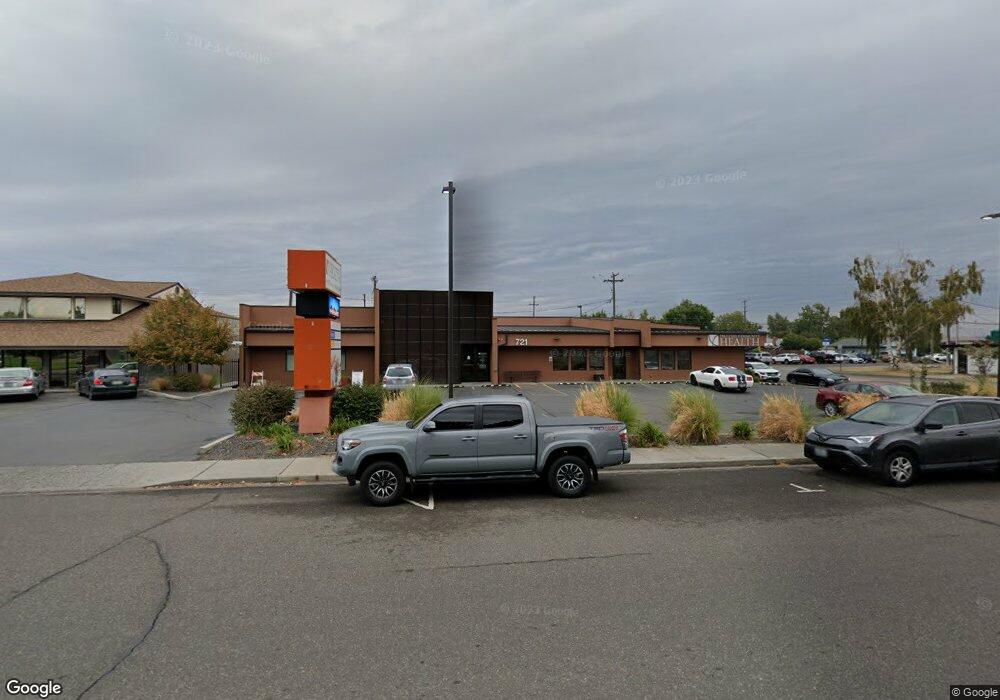
721 S Auburn St Kennewick, WA 99336
Estimated Value: $2,171,440
--
Bed
--
Bath
8,795
Sq Ft
$247/Sq Ft
Est. Value
About This Home
This home is located at 721 S Auburn St, Kennewick, WA 99336 and is currently estimated at $2,171,440, approximately $246 per square foot. 721 S Auburn St is a home located in Benton County with nearby schools including Washington Elementary School, Park Middle School, and Kennewick High School.
Ownership History
Date
Name
Owned For
Owner Type
Purchase Details
Closed on
Nov 28, 2016
Sold by
Wannarachue Nikom and Wannarachue Josefina
Bought by
Tri Cities Community Health
Current Estimated Value
Home Financials for this Owner
Home Financials are based on the most recent Mortgage that was taken out on this home.
Original Mortgage
$840,000
Interest Rate
3.47%
Mortgage Type
Commercial
Purchase Details
Closed on
Oct 27, 2005
Sold by
Villanueva Isagani E and Villanueva C
Bought by
Wannarachue Nikom and Wannarachue Josefina
Home Financials for this Owner
Home Financials are based on the most recent Mortgage that was taken out on this home.
Original Mortgage
$360,000
Interest Rate
5.9%
Mortgage Type
Commercial
Create a Home Valuation Report for This Property
The Home Valuation Report is an in-depth analysis detailing your home's value as well as a comparison with similar homes in the area
Home Values in the Area
Average Home Value in this Area
Purchase History
| Date | Buyer | Sale Price | Title Company |
|---|---|---|---|
| Tri Cities Community Health | $1,050,000 | Chicago Title | |
| Wannarachue Nikom | $58,000 | Benton Franklin Titl |
Source: Public Records
Mortgage History
| Date | Status | Borrower | Loan Amount |
|---|---|---|---|
| Previous Owner | Tri Cities Community Health | $840,000 | |
| Previous Owner | Wannarachue Nikom | $360,000 |
Source: Public Records
Tax History Compared to Growth
Tax History
| Year | Tax Paid | Tax Assessment Tax Assessment Total Assessment is a certain percentage of the fair market value that is determined by local assessors to be the total taxable value of land and additions on the property. | Land | Improvement |
|---|---|---|---|---|
| 2024 | $47 | $561,650 | $73,560 | $488,090 |
| 2023 | $47 | $561,650 | $73,560 | $488,090 |
| 2022 | $39 | $507,900 | $58,850 | $449,050 |
| 2021 | $36 | $479,530 | $54,670 | $424,860 |
| 2020 | $33 | $479,530 | $54,670 | $424,860 |
| 2019 | $33 | $479,530 | $54,670 | $424,860 |
| 2018 | $0 | $479,530 | $54,670 | $424,860 |
| 2017 | $5,535 | $479,530 | $54,670 | $424,860 |
| 2016 | $5,798 | $479,530 | $54,670 | $424,860 |
| 2015 | $5,842 | $494,130 | $61,060 | $433,070 |
| 2014 | -- | $494,130 | $61,060 | $433,070 |
| 2013 | -- | $494,130 | $61,060 | $433,070 |
Source: Public Records
Map
Nearby Homes
- 305 W 10th Ave
- 325 W 11th Ave
- 415 E 8th Ave
- 2731 S Alder St
- 2707 S Alder St
- 626 S Everett St
- 602 E 8th Ave
- 205 E 15th Ave
- 309 E 2nd Ave
- 1631 S Dayton Place
- 114 S Alder St
- 408 S Gum St
- 811 E 4th Ave
- 451 E 15th Place
- 920 W 14th Place
- 523 W Kennewick Ave
- 422 W Kennewick Ave
- 415 W Albany Ave
- 721 E 15th Ave
- 818 S Juniper St
- 711 S Auburn St
- 803 S Auburn St
- 712 S Washington St
- 809 S Auburn St
- 805 S Auburn St
- 805 & 807 W Auburn St
- 805 & 807 W Albany St
- 813 S Auburn St
- 811 S Auburn St
- 719 S Washington St
- 711 S Washington St
- 707 S Washington St
- 803 S Washington St
- 903 S Auburn St
- 703 S Washington St
- 905 S Auburn St
- 907 S Auburn St
- 623 S Washington St
- 809 S Washington St
- 619 S Washington St