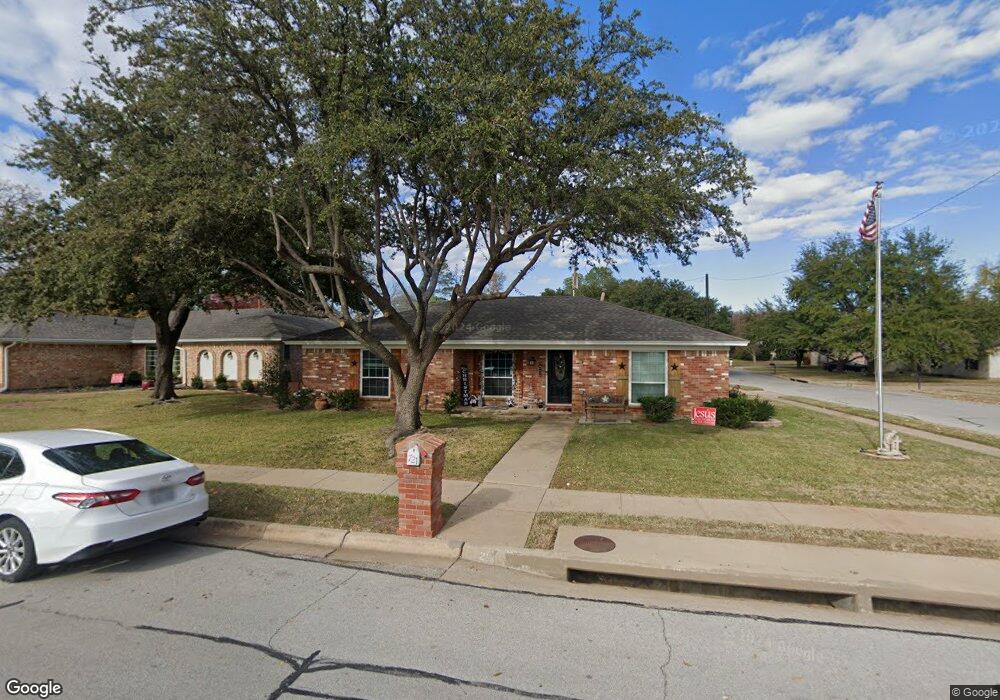
721 Sandlin Dr Bedford, TX 76021
Estimated Value: $359,651 - $392,000
3
Beds
2
Baths
1,744
Sq Ft
$212/Sq Ft
Est. Value
About This Home
This home is located at 721 Sandlin Dr, Bedford, TX 76021 and is currently estimated at $369,913, approximately $212 per square foot. 721 Sandlin Dr is a home located in Tarrant County with nearby schools including Bedford Heights Elementary School, Bedford Junior High School, and L.D. Bell High School.
Ownership History
Date
Name
Owned For
Owner Type
Purchase Details
Closed on
Jan 29, 2024
Sold by
Horton Stanley Richard
Bought by
Horton Barbara Ann
Current Estimated Value
Purchase Details
Closed on
Jul 31, 2008
Sold by
Gardner Michael A and Gardner Delia R
Bought by
Horton Stan and Horton Barbara
Home Financials for this Owner
Home Financials are based on the most recent Mortgage that was taken out on this home.
Original Mortgage
$168,379
Interest Rate
6.47%
Mortgage Type
Purchase Money Mortgage
Purchase Details
Closed on
Jan 15, 2008
Sold by
Beauchamp Clayton E and Beauchamp Dayla
Bought by
Gardner Michael A and Gardner Delia R
Home Financials for this Owner
Home Financials are based on the most recent Mortgage that was taken out on this home.
Original Mortgage
$96,000
Interest Rate
6.11%
Mortgage Type
Purchase Money Mortgage
Create a Home Valuation Report for This Property
The Home Valuation Report is an in-depth analysis detailing your home's value as well as a comparison with similar homes in the area
Home Values in the Area
Average Home Value in this Area
Purchase History
| Date | Buyer | Sale Price | Title Company |
|---|---|---|---|
| Horton Barbara Ann | -- | None Listed On Document | |
| Horton Stan | -- | None Available | |
| Gardner Michael A | -- | Alamo Title Company |
Source: Public Records
Mortgage History
| Date | Status | Borrower | Loan Amount |
|---|---|---|---|
| Previous Owner | Horton Stan | $168,379 | |
| Previous Owner | Gardner Michael A | $96,000 |
Source: Public Records
Tax History Compared to Growth
Tax History
| Year | Tax Paid | Tax Assessment Tax Assessment Total Assessment is a certain percentage of the fair market value that is determined by local assessors to be the total taxable value of land and additions on the property. | Land | Improvement |
|---|---|---|---|---|
| 2025 | $1,201 | $302,246 | $75,000 | $227,246 |
| 2024 | $1,201 | $302,246 | $75,000 | $227,246 |
| 2023 | $5,411 | $293,556 | $40,000 | $253,556 |
| 2022 | $5,601 | $256,462 | $40,000 | $216,462 |
| 2021 | $5,527 | $234,613 | $40,000 | $194,613 |
| 2020 | $6,031 | $260,414 | $40,000 | $220,414 |
| 2019 | $5,602 | $263,164 | $40,000 | $223,164 |
| 2018 | $2,599 | $209,633 | $40,000 | $169,633 |
| 2017 | $4,610 | $205,812 | $28,000 | $177,812 |
| 2016 | $4,191 | $174,075 | $28,000 | $146,075 |
| 2015 | $2,620 | $157,500 | $15,000 | $142,500 |
| 2014 | $2,620 | $157,500 | $15,000 | $142,500 |
Source: Public Records
Map
Nearby Homes
- 3213 Spring Valley Dr
- 3119 Spring Grove Dr
- 913 Kensington Ct
- 3605 Spring Valley Dr
- 801 Shady Creek Ln
- 3609 Wayne Ct
- 922 Shady Creek Ln
- 3624 Wayne Ct
- 320 Blue Quail Ct
- 1013 Springdale Rd
- 909 Brestol Ct W
- 305 Warbler Dr
- 405 Woodbriar Ct
- 1109 Simpson Terrace
- 2704 Shady Grove Dr
- 628 Huntwich Dr
- 2700 Shady Grove Dr
- 3301 Wendover Ct
- 432 Sunnybrook Ct
- 817 Shady Lake Dr
- 717 Sandlin Dr
- 3305 Spring Valley Dr
- 713 Sandlin Dr
- 3221 Spring Valley Dr
- 3304 Spring Valley Dr
- 3300 Spring Valley Dr
- 3306 Spring Valley Dr
- 3228 Spring Valley Dr
- 3309 Spring Valley Dr
- 709 Sandlin Dr
- 3217 Spring Valley Dr
- 3300 Robinhood Ct
- 712 Sandlin Dr
- 708 Robinhood Ln
- 3308 Spring Valley Dr
- 3224 Spring Valley Dr
- 705 Sandlin Dr
- 708 Sandlin Dr
- 3313 Spring Valley Dr
- 3220 Spring Valley Dr