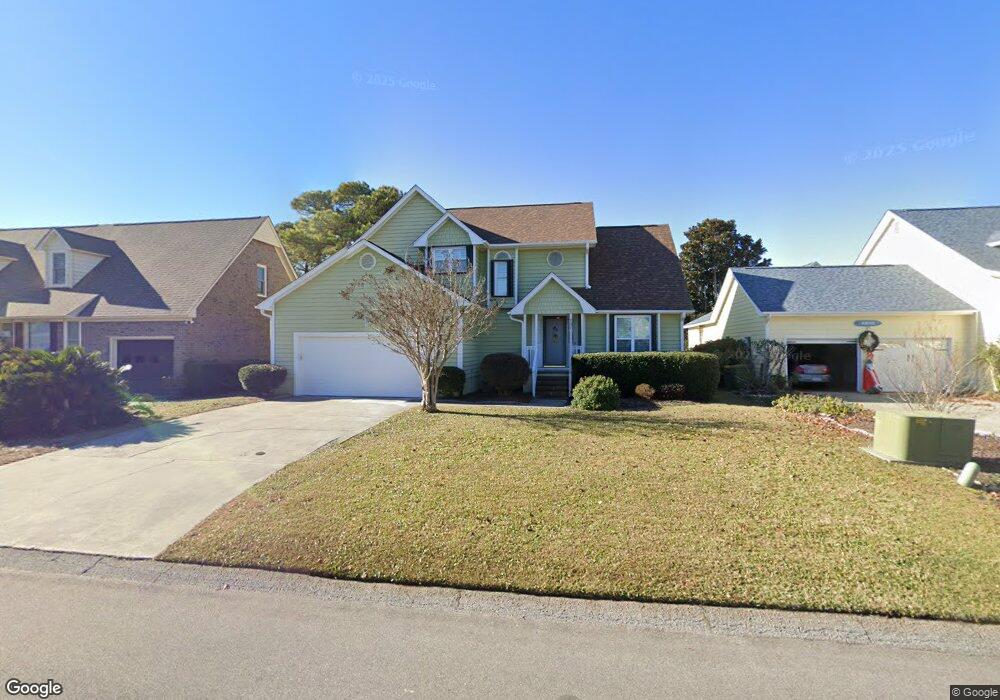
721 Sloop Pointe Ln Kure Beach, NC 28449
Estimated Value: $662,000 - $958,000
4
Beds
3
Baths
2,878
Sq Ft
$284/Sq Ft
Est. Value
About This Home
This home is located at 721 Sloop Pointe Ln, Kure Beach, NC 28449 and is currently estimated at $817,180, approximately $283 per square foot. 721 Sloop Pointe Ln is a home located in New Hanover County with nearby schools including Carolina Beach Elementary School, Charles P. Murray Middle School, and Eugene Ashley High School.
Ownership History
Date
Name
Owned For
Owner Type
Purchase Details
Closed on
May 9, 2014
Sold by
Raquet Joyce
Bought by
M Canary Llc
Current Estimated Value
Purchase Details
Closed on
Jul 6, 1994
Sold by
Suchsland Mary Trustee
Bought by
Suchsland Mary Ormal Dean
Purchase Details
Closed on
May 11, 1992
Sold by
Suchsland Ormal Dean Mary
Bought by
Suchsland Ormal D Mary Family
Purchase Details
Closed on
Feb 28, 1991
Sold by
Rooks W Howard
Bought by
Suchsland Ormal Dean Mary
Purchase Details
Closed on
Feb 5, 1990
Sold by
Pfs Financial Services
Bought by
Rooks W Howard
Purchase Details
Closed on
May 19, 1989
Sold by
Brown James C
Bought by
Pfs Financial Services Inc
Purchase Details
Closed on
Aug 1, 1988
Sold by
Hudson Leon J Grace L
Bought by
Brown James C
Purchase Details
Closed on
Nov 1, 1985
Sold by
Beach Club Properties
Bought by
Hudson Leon J Grace L
Purchase Details
Closed on
Oct 1, 1985
Bought by
Beach Club Properties
Create a Home Valuation Report for This Property
The Home Valuation Report is an in-depth analysis detailing your home's value as well as a comparison with similar homes in the area
Home Values in the Area
Average Home Value in this Area
Purchase History
| Date | Buyer | Sale Price | Title Company |
|---|---|---|---|
| M Canary Llc | $138,000 | None Available | |
| Suchsland Mary Ormal Dean | -- | -- | |
| Suchsland Ormal D Mary Family | -- | -- | |
| Suchsland Ormal Dean Mary | $26,000 | -- | |
| Rooks W Howard | $2,309,000 | -- | |
| Pfs Financial Services Inc | -- | -- | |
| Brown James C | $24,500 | -- | |
| Hudson Leon J Grace L | $36,500 | -- | |
| Beach Club Properties | -- | -- |
Source: Public Records
Tax History
| Year | Tax Paid | Tax Assessment Tax Assessment Total Assessment is a certain percentage of the fair market value that is determined by local assessors to be the total taxable value of land and additions on the property. | Land | Improvement |
|---|---|---|---|---|
| 2025 | $3,118 | $652,200 | $286,300 | $365,900 |
| 2023 | $3,404 | $475,500 | $165,400 | $310,100 |
| 2022 | $3,427 | $475,500 | $165,400 | $310,100 |
| 2021 | $3,523 | $475,500 | $165,400 | $310,100 |
| 2020 | $3,430 | $383,200 | $178,100 | $205,100 |
| 2019 | $3,430 | $383,200 | $178,100 | $205,100 |
| 2018 | $3,391 | $383,200 | $178,100 | $205,100 |
| 2017 | $3,276 | $383,200 | $178,100 | $205,100 |
| 2016 | $3,107 | $342,200 | $144,300 | $197,900 |
| 2015 | $2,859 | $342,200 | $144,300 | $197,900 |
| 2014 | $2,791 | $342,200 | $144,300 | $197,900 |
Source: Public Records
Map
Nearby Homes
- 718 Sloop Pointe Ln
- 734 Cutter Ct
- 130 Heather Ln
- 765 Sloop Pointe Ln
- 221 Seawatch Way Unit LT5050
- 717 Settlers Ln
- 305 Kure Village Way
- 129 Seawatch Way
- 114 Leeward Ct
- 745 Settlers Ln
- 822 Cutter Ct
- 737 Fort Fisher Blvd N
- 192 Seawatch Way
- 509 Seahorse Place
- 402 Fort Fisher Blvd N
- 116 Myrtle Ave
- 124 Ocean View Ave
- 465 Fort Fisher Blvd N
- 113 Ocean View Ave
- 115 Hanby Ave Unit B
- 717 Sloop Pointe Ln
- 725 Sloop Pointe Ln
- 718 Sailor Ct
- 714 Sailor Ct
- 726 Sloop Pointe Ln
- 722 Sailor Ct
- 710 Sailor Ct
- 737 Sailor Ct
- 709 Sloop Pointe Ln
- 722 Sloop Pointe Ln Unit 44R
- 729 Sloop Pointe Ln
- 726 Sailor Ct
- 714 Sloop Pointe Ln
- 730 Sloop Pointe Ln
- 733 Sloop Pointe Ln
- 810 Kure Village Way
- 806 Kure Village Way
- 710 Sloop Pointe Ln
- 730 Sailor Ct
- 333 Sealane Way
Your Personal Tour Guide
Ask me questions while you tour the home.