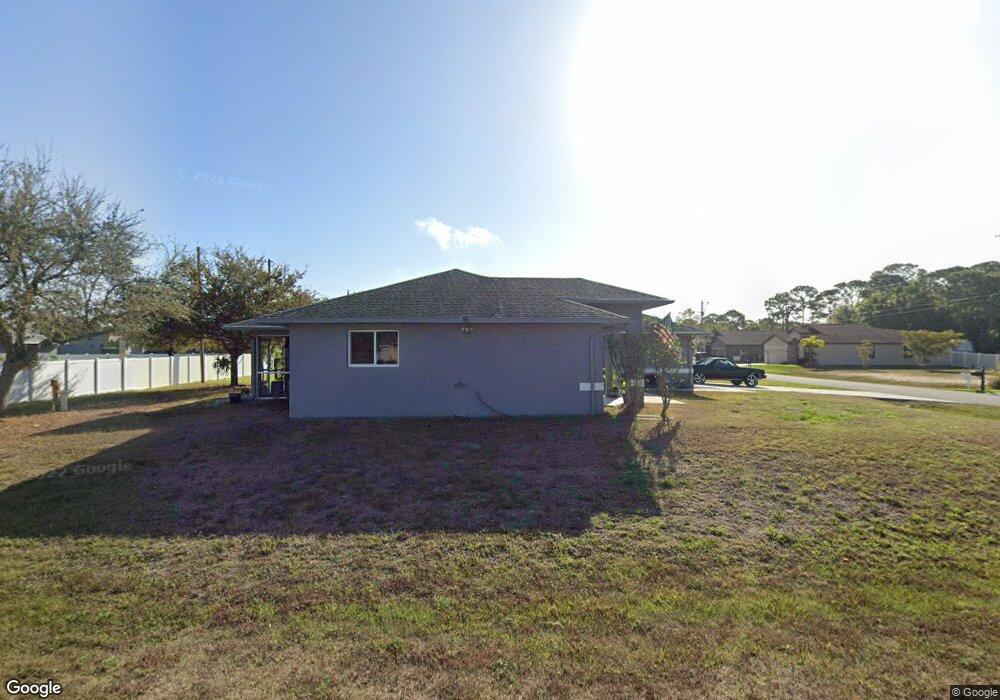
721 SW 4th Terrace Cape Coral, FL 33991
Hancock NeighborhoodEstimated Value: $266,000 - $372,000
3
Beds
2
Baths
1,431
Sq Ft
$222/Sq Ft
Est. Value
About This Home
This home is located at 721 SW 4th Terrace, Cape Coral, FL 33991 and is currently estimated at $317,572, approximately $221 per square foot. 721 SW 4th Terrace is a home located in Lee County with nearby schools including Caloosa Elementary School, Tropic Isles Elementary School, and Hancock Creek Elementary School.
Ownership History
Date
Name
Owned For
Owner Type
Purchase Details
Closed on
Nov 13, 2021
Sold by
Mikkelsen Janet and Mikkelsen Joey Glen
Bought by
Mikkelsen Jesse Paul and Mikkelsen Joey Glen
Current Estimated Value
Purchase Details
Closed on
Jun 11, 2020
Sold by
Hernandez Rosa Maria and Rodriguez Rosa
Bought by
Mikkelsen Janet and Mikkelsen Glen
Purchase Details
Closed on
Dec 22, 2016
Sold by
Mikkelsen Janet and Mikkelsen Janet
Bought by
Hernandez Rosa
Purchase Details
Closed on
Sep 17, 2010
Sold by
Rodriguez Robert
Bought by
Perez Aniceto
Purchase Details
Closed on
Aug 6, 2004
Sold by
Mikkelsen Janet and Mikkelsen Jason
Bought by
Rodriguez Robert
Home Financials for this Owner
Home Financials are based on the most recent Mortgage that was taken out on this home.
Original Mortgage
$110,880
Interest Rate
3.95%
Mortgage Type
Unknown
Purchase Details
Closed on
Jun 28, 2002
Sold by
Galvez Carlos A
Bought by
Rodriguez Robert and Mikkelsen Joex
Create a Home Valuation Report for This Property
The Home Valuation Report is an in-depth analysis detailing your home's value as well as a comparison with similar homes in the area
Home Values in the Area
Average Home Value in this Area
Purchase History
| Date | Buyer | Sale Price | Title Company |
|---|---|---|---|
| Mikkelsen Jesse Paul | -- | None Available | |
| Mikkelsen Janet | -- | None Available | |
| Hernandez Rosa | -- | None Available | |
| Perez Aniceto | $70,000 | Paradise Professional Title | |
| Rodriguez Robert | -- | First Cmnty Title Svcs Inc | |
| Rodriguez Robert | $5,700 | -- | |
| Galvez Carlos A | $4,000 | -- |
Source: Public Records
Mortgage History
| Date | Status | Borrower | Loan Amount |
|---|---|---|---|
| Previous Owner | Rodriguez Robert | $110,880 |
Source: Public Records
Tax History Compared to Growth
Tax History
| Year | Tax Paid | Tax Assessment Tax Assessment Total Assessment is a certain percentage of the fair market value that is determined by local assessors to be the total taxable value of land and additions on the property. | Land | Improvement |
|---|---|---|---|---|
| 2025 | $5,236 | $238,695 | $66,215 | $172,480 |
| 2024 | $5,138 | $257,961 | $85,058 | $172,903 |
| 2023 | $5,138 | $251,070 | $0 | $0 |
| 2022 | $4,905 | $243,757 | $44,000 | $199,757 |
| 2021 | $4,762 | $181,161 | $22,000 | $159,161 |
| 2020 | $4,573 | $163,927 | $22,000 | $141,927 |
| 2019 | $4,461 | $161,505 | $22,000 | $139,505 |
| 2018 | $4,376 | $152,617 | $20,000 | $132,617 |
| 2017 | $4,269 | $142,928 | $15,300 | $127,628 |
| 2016 | $3,826 | $128,489 | $15,300 | $113,189 |
| 2015 | $3,632 | $114,992 | $10,500 | $104,492 |
| 2014 | -- | $103,612 | $7,050 | $96,562 |
| 2013 | -- | $91,304 | $5,100 | $86,204 |
Source: Public Records
Map
Nearby Homes
- 511 SW 7th Place
- 1914,1918,1922 SW 7th Place
- 715 SW 5th St
- 628 SW 3rd Terrace
- 615 SW 3rd Terrace
- 611 SW 3rd Terrace
- 611 SW 4th St Unit 27
- 740 SW 5th St
- 758 SW 4th St
- 510 Skyline Blvd
- 506 SW 5th St
- 516 SW 2nd Terrace
- 817 SW 8th St
- 500 SW 8th Place Unit 25
- 447 SW 6th St
- 604 SW 8th Place
- 900 SW 4th Terrace
- 1015 Ceitus Terrace
- 611 SW 8th Ct
- 747 SW 9th St
- 717 Sw Terrace
- 717 SW 4th Terrace
- 720 SW 4th St
- 410 SW 7th Ct
- 715 SW 4th Terrace
- 713 SW 4th Terrace
- 406 SW 7th Ct
- 414 SW 7th Ct
- 716 SW 4th Terrace
- 716 SW 4th Terrace
- 710 SW 4th St
- 709 SW 4th Terrace
- 712 SW 4th Terrace
- 420 SW 7th Ct
- 509 SW 7th Place Unit 32
- 509 SW 7th Place
- 328 SW 7th Ct
- 710 SW 4 St
- 708 SW 4th Terrace