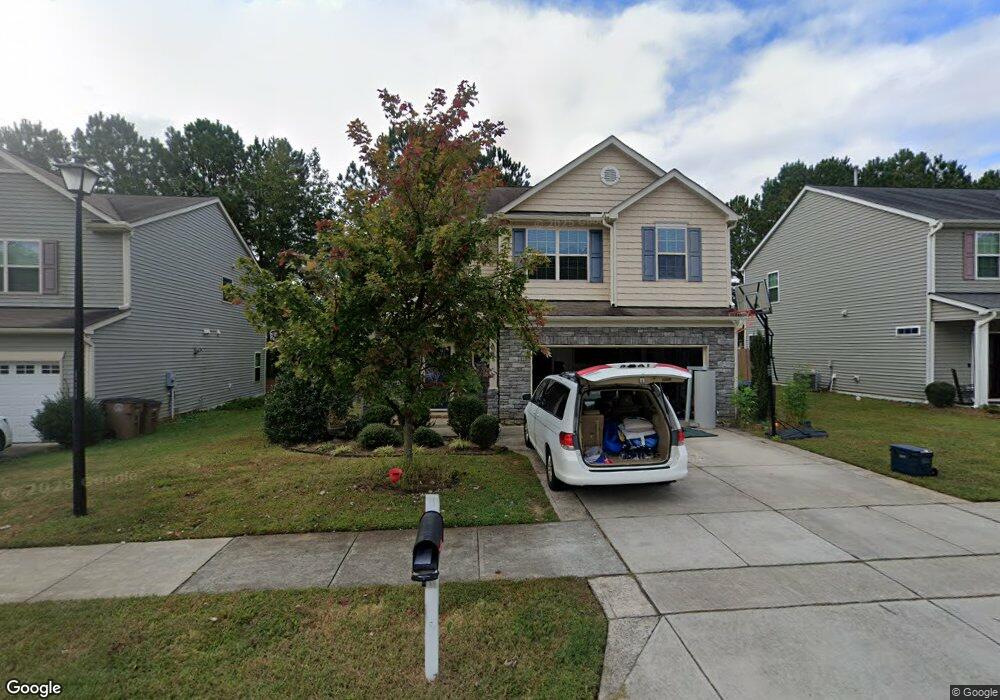
721 Tannerwell Ave Unit L1289 Wake Forest, NC 27587
Estimated Value: $393,574 - $428,000
3
Beds
3
Baths
2,137
Sq Ft
$192/Sq Ft
Est. Value
About This Home
This home is located at 721 Tannerwell Ave Unit L1289, Wake Forest, NC 27587 and is currently estimated at $410,644, approximately $192 per square foot. 721 Tannerwell Ave Unit L1289 is a home located in Franklin County with nearby schools including Youngsville Elementary, Cedar Creek Middle, and Franklinton High School.
Ownership History
Date
Name
Owned For
Owner Type
Purchase Details
Closed on
Sep 11, 2019
Sold by
Wood Cynthia A
Bought by
Noble Brandon F and Noble Brittany R
Current Estimated Value
Home Financials for this Owner
Home Financials are based on the most recent Mortgage that was taken out on this home.
Original Mortgage
$181,500
Outstanding Balance
$158,282
Interest Rate
3.6%
Mortgage Type
New Conventional
Estimated Equity
$252,362
Purchase Details
Closed on
Jul 24, 2017
Sold by
Wood Billy Ray
Bought by
Wood Cynthia Ann
Purchase Details
Closed on
Aug 14, 2014
Sold by
D R Horton Inc
Bought by
Wood Cynthia A and Wood Billy Ray
Home Financials for this Owner
Home Financials are based on the most recent Mortgage that was taken out on this home.
Original Mortgage
$159,200
Interest Rate
4.16%
Mortgage Type
New Conventional
Purchase Details
Closed on
Mar 20, 2013
Sold by
Richland Hills Llc
Bought by
D R Horton Inc
Create a Home Valuation Report for This Property
The Home Valuation Report is an in-depth analysis detailing your home's value as well as a comparison with similar homes in the area
Home Values in the Area
Average Home Value in this Area
Purchase History
| Date | Buyer | Sale Price | Title Company |
|---|---|---|---|
| Noble Brandon F | $256,500 | None Available | |
| Wood Cynthia Ann | -- | None Available | |
| Wood Cynthia A | $199,000 | None Available | |
| D R Horton Inc | $432,500 | None Available |
Source: Public Records
Mortgage History
| Date | Status | Borrower | Loan Amount |
|---|---|---|---|
| Open | Noble Brandon F | $181,500 | |
| Previous Owner | Wood Cynthia A | $159,200 |
Source: Public Records
Tax History Compared to Growth
Tax History
| Year | Tax Paid | Tax Assessment Tax Assessment Total Assessment is a certain percentage of the fair market value that is determined by local assessors to be the total taxable value of land and additions on the property. | Land | Improvement |
|---|---|---|---|---|
| 2025 | $3,639 | $381,500 | $115,000 | $266,500 |
| 2024 | $3,760 | $381,500 | $115,000 | $266,500 |
| 2023 | $3,035 | $226,760 | $42,000 | $184,760 |
| 2022 | $3,003 | $226,760 | $42,000 | $184,760 |
| 2021 | $3,025 | $226,760 | $42,000 | $184,760 |
| 2020 | $3,033 | $226,760 | $42,000 | $184,760 |
| 2019 | $3,080 | $226,760 | $42,000 | $184,760 |
| 2018 | $3,075 | $226,760 | $42,000 | $184,760 |
| 2017 | $2,648 | $182,390 | $39,000 | $143,390 |
| 2016 | $2,716 | $182,390 | $39,000 | $143,390 |
| 2015 | $2,716 | $182,390 | $39,000 | $143,390 |
| 2014 | $2,595 | $182,390 | $39,000 | $143,390 |
Source: Public Records
Map
Nearby Homes
- 824 Stackhurst Way
- 1300 Marbank St
- 1418 Chatuga Way
- 308 Colin Ct
- 1320 Hosmer Ct
- 501 Rain Drizzle Ct
- 1116 Crendall Way
- 1233 Shadow Shade Dr
- 1200 Crendall Way
- 1624 Ripley Woods St
- 880 Whistable Ave
- 1740 Ripley Woods St
- 517 Wheddon Cross Way
- 524 Findhorn Ln
- 0 Ralph Dr
- 508 Ferry Ct
- 1041 Barnford Mill Rd
- 404 Porterfield Dr
- 412 Newquay Ln
- 104 Jordan Ln
- 721 Tannerwell Ave
- 725 Tannerwell Ave
- 717 Tannerwell Ave Unit Lt292
- 717 Tannerwell Ave Unit Lt288
- 717 Tannerwell Ave
- 729 Tannerwell Ave Unit Lt291
- 729 Tannerwell Ave Unit L1291
- 729 Tannerwell Ave
- 713 Tannerwell Ave
- 808 Stackhurst Way
- 812 Stackhurst Way
- 804 Stackhurst Way
- 800 Stackhurst Way
- 801 Tannerwell Ave Unit LT292
- 709 Tannerwell Ave
- 716 Tannerwell Ave Unit L1316
- 716 Tannerwell Ave
- 720 Tannerwell Ave
- 816 Stackhurst Way
- 712 Tannerwell Ave Unit L1317