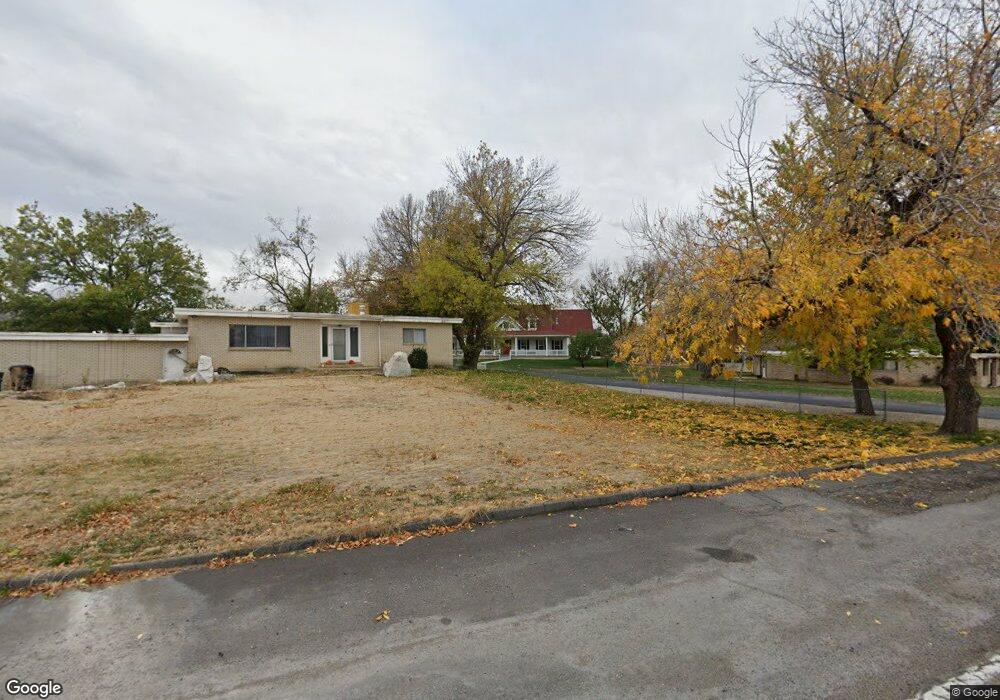
721 W 400 N West Bountiful, UT 84087
Estimated Value: $1,656,000 - $1,928,440
5
Beds
4
Baths
5,694
Sq Ft
$312/Sq Ft
Est. Value
About This Home
This home is located at 721 W 400 N, West Bountiful, UT 84087 and is currently estimated at $1,778,480, approximately $312 per square foot. 721 W 400 N is a home with nearby schools including West Bountiful Elementary School, Bountiful Junior High School, and Viewmont High School.
Ownership History
Date
Name
Owned For
Owner Type
Purchase Details
Closed on
Apr 14, 2020
Sold by
Carbone Joseph G and Carbone Jan W
Bought by
Herringbone Group Llc
Current Estimated Value
Home Financials for this Owner
Home Financials are based on the most recent Mortgage that was taken out on this home.
Original Mortgage
$483,310
Outstanding Balance
$332,309
Interest Rate
3.2%
Mortgage Type
New Conventional
Estimated Equity
$1,446,171
Purchase Details
Closed on
May 21, 2018
Sold by
Carbone Joseph G and Carbone Jan W
Bought by
Herringbone Group Llc
Purchase Details
Closed on
Nov 21, 2012
Sold by
Widdison Elon I
Bought by
Carbone Joseph G
Home Financials for this Owner
Home Financials are based on the most recent Mortgage that was taken out on this home.
Original Mortgage
$240,000
Interest Rate
3.35%
Mortgage Type
Purchase Money Mortgage
Create a Home Valuation Report for This Property
The Home Valuation Report is an in-depth analysis detailing your home's value as well as a comparison with similar homes in the area
Home Values in the Area
Average Home Value in this Area
Purchase History
| Date | Buyer | Sale Price | Title Company |
|---|---|---|---|
| Herringbone Group Llc | -- | Title Guarantee | |
| Carbone Joseph G | -- | Title Guarantee Settl | |
| Herringbone Group Llc | -- | Backman Title | |
| Carbone Joseph G | -- | Metro National Title | |
| Carbone Joseph G | -- | Metro National Title |
Source: Public Records
Mortgage History
| Date | Status | Borrower | Loan Amount |
|---|---|---|---|
| Open | Carbone Joseph G | $483,310 | |
| Previous Owner | Carbone Joseph G | $240,000 |
Source: Public Records
Tax History Compared to Growth
Tax History
| Year | Tax Paid | Tax Assessment Tax Assessment Total Assessment is a certain percentage of the fair market value that is determined by local assessors to be the total taxable value of land and additions on the property. | Land | Improvement |
|---|---|---|---|---|
| 2025 | $10,089 | $856,244 | $319,345 | $536,899 |
| 2024 | $9,269 | $747,449 | $242,052 | $505,397 |
| 2023 | $9,250 | $770,000 | $224,398 | $545,601 |
| 2022 | $9,275 | $1,430,000 | $399,051 | $1,030,949 |
| 2021 | $8,366 | $1,084,000 | $333,779 | $750,221 |
| 2020 | $7,432 | $955,000 | $267,626 | $687,374 |
| 2019 | $7,251 | $925,000 | $241,517 | $683,483 |
| 2018 | $6,444 | $796,000 | $214,583 | $581,417 |
| 2016 | $6,420 | $457,802 | $157,338 | $300,464 |
| 2015 | $6,952 | $476,887 | $157,338 | $319,549 |
| 2014 | $2,510 | $170,684 | $157,338 | $13,346 |
| 2013 | -- | $132,181 | $132,181 | $0 |
Source: Public Records
Map
Nearby Homes
- 767 W 220 N
- 340 N 500 W Unit 204
- 680 W 500 S Unit 22
- 680 W 500 S Unit 17
- 399 W 400 N Unit 47
- 790 N 500 W
- 280 N 1100 W
- 167 S 425 W
- 314 W Center St Unit D135
- 314 W Center St Unit D159
- 314 W Center St Unit E150
- 155 N Peregrine Ln W
- 825 W 1320 N
- 75 N Peregrine Ln W Unit 8
- 366 W 1000 N
- 131 W 25 N Unit 4
- 147 W 25 N Unit 5
- 499 N 200 W Unit 30
- 499 N 200 W Unit 19
- 553 N 200 W