Estimated Value: $516,000 - $572,000
--
Bed
--
Bath
1,668
Sq Ft
$327/Sq Ft
Est. Value
About This Home
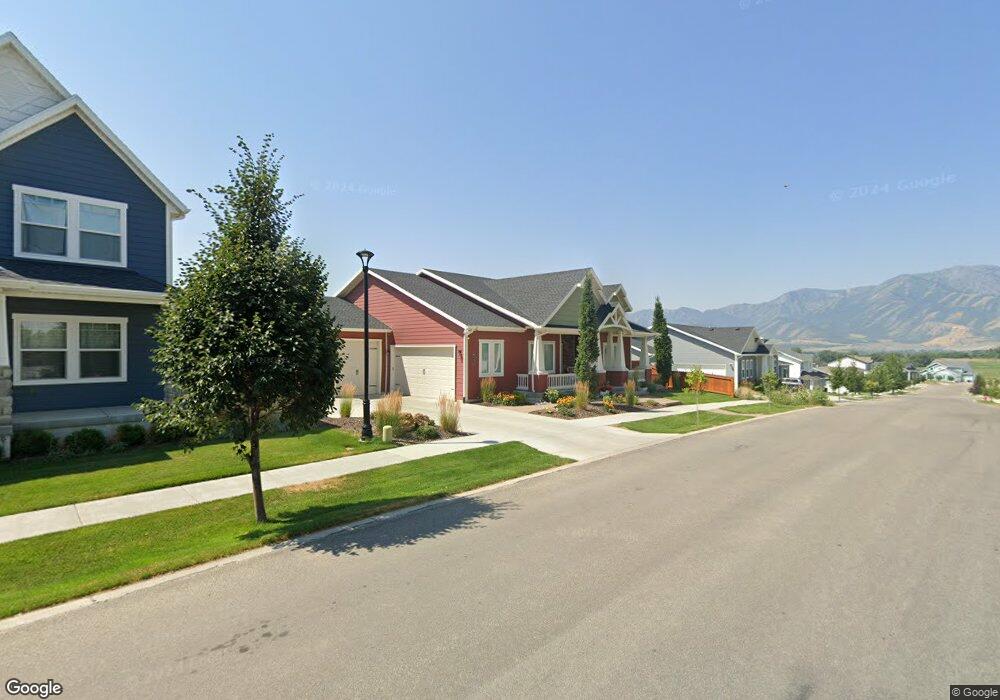
This home is located at 721 W 50 N, Hyrum, UT 84319 and is currently estimated at $545,690, approximately $327 per square foot. 721 W 50 N is a home with nearby schools including Lincoln School, South Cache Middle School, and Mountain Crest High School.
Ownership History
Date
Name
Owned For
Owner Type
Purchase Details
Closed on
Apr 26, 2024
Sold by
Slater Marcia L and Gibby Jonni Lynn
Bought by
Marcia L Slater Revocable Trust and Slater
Current Estimated Value
Purchase Details
Closed on
May 5, 2021
Sold by
Slater Marcia L
Bought by
Slater Marcia L and Gibby Jonni Lynn
Purchase Details
Closed on
Oct 29, 2015
Sold by
Solid Homes Inc
Bought by
Slater John D and Slater Marcia L
Home Financials for this Owner
Home Financials are based on the most recent Mortgage that was taken out on this home.
Original Mortgage
$215,000
Interest Rate
3.81%
Mortgage Type
New Conventional
Purchase Details
Closed on
Apr 16, 2015
Sold by
Lsh Development Llc
Bought by
Solid Homes Inc and Lifestyle Homes
Home Financials for this Owner
Home Financials are based on the most recent Mortgage that was taken out on this home.
Original Mortgage
$261,600
Interest Rate
3.7%
Mortgage Type
Construction
Create a Home Valuation Report for This Property
The Home Valuation Report is an in-depth analysis detailing your home's value as well as a comparison with similar homes in the area
Home Values in the Area
Average Home Value in this Area
Purchase History
| Date | Buyer | Sale Price | Title Company |
|---|---|---|---|
| Marcia L Slater Revocable Trust | -- | None Listed On Document | |
| Slater Marcia L | -- | Cache Title Company Inc | |
| Slater John D | -- | Hickman Land Title Company | |
| Solid Homes Inc | -- | Hickman Land Title Company |
Source: Public Records
Mortgage History
| Date | Status | Borrower | Loan Amount |
|---|---|---|---|
| Previous Owner | Slater John D | $215,000 | |
| Previous Owner | Solid Homes Inc | $261,600 |
Source: Public Records
Tax History Compared to Growth
Tax History
| Year | Tax Paid | Tax Assessment Tax Assessment Total Assessment is a certain percentage of the fair market value that is determined by local assessors to be the total taxable value of land and additions on the property. | Land | Improvement |
|---|---|---|---|---|
| 2025 | $2,544 | $365,285 | $0 | $0 |
| 2024 | $247 | $331,040 | $0 | $0 |
| 2023 | $2,632 | $337,480 | $0 | $0 |
| 2022 | $2,747 | $337,480 | $0 | $0 |
| 2021 | $1,980 | $374,855 | $73,000 | $301,855 |
| 2020 | $1,889 | $335,483 | $73,000 | $262,483 |
| 2019 | $1,978 | $330,483 | $68,000 | $262,483 |
| 2018 | $1,872 | $302,360 | $68,000 | $234,360 |
| 2017 | $1,911 | $160,160 | $0 | $0 |
| 2016 | $1,954 | $155,815 | $0 | $0 |
Source: Public Records
Map
Nearby Homes