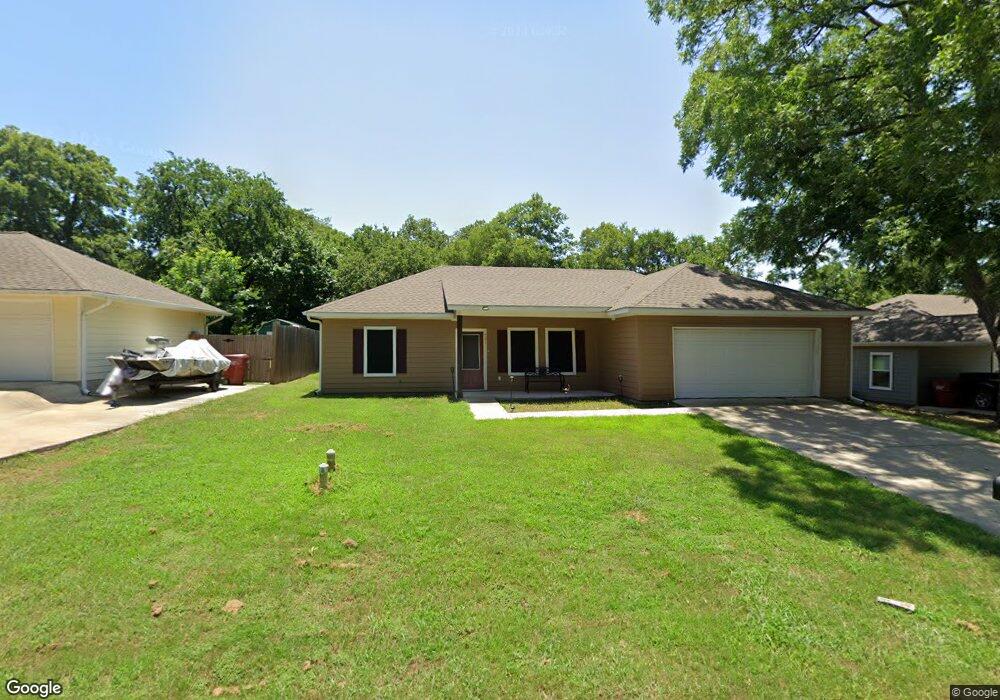
721 W 7th St Bonham, TX 75418
Estimated Value: $222,000 - $241,000
3
Beds
2
Baths
1,268
Sq Ft
$181/Sq Ft
Est. Value
About This Home
This home is located at 721 W 7th St, Bonham, TX 75418 and is currently estimated at $229,756, approximately $181 per square foot. 721 W 7th St is a home located in Fannin County with nearby schools including Finley-Oates Elementary School, LH Rather Jr High School, and Morning Star Academy.
Ownership History
Date
Name
Owned For
Owner Type
Purchase Details
Closed on
Jun 12, 2019
Sold by
Kingston Land Development Llc
Bought by
Amartey Joyce Amorkor
Current Estimated Value
Home Financials for this Owner
Home Financials are based on the most recent Mortgage that was taken out on this home.
Original Mortgage
$140,553
Outstanding Balance
$123,066
Interest Rate
4.1%
Mortgage Type
New Conventional
Estimated Equity
$106,690
Create a Home Valuation Report for This Property
The Home Valuation Report is an in-depth analysis detailing your home's value as well as a comparison with similar homes in the area
Home Values in the Area
Average Home Value in this Area
Purchase History
| Date | Buyer | Sale Price | Title Company |
|---|---|---|---|
| Amartey Joyce Amorkor | -- | Cole Title Co |
Source: Public Records
Mortgage History
| Date | Status | Borrower | Loan Amount |
|---|---|---|---|
| Open | Amartey Joyce Amorkor | $140,553 |
Source: Public Records
Tax History Compared to Growth
Tax History
| Year | Tax Paid | Tax Assessment Tax Assessment Total Assessment is a certain percentage of the fair market value that is determined by local assessors to be the total taxable value of land and additions on the property. | Land | Improvement |
|---|---|---|---|---|
| 2025 | $4,685 | $238,500 | $37,860 | $200,640 |
| 2024 | $4,685 | $241,560 | $36,340 | $205,220 |
| 2023 | $4,436 | $224,950 | $25,270 | $199,680 |
| 2022 | $4,603 | $209,290 | $17,250 | $192,040 |
| 2021 | $4,223 | $167,100 | $10,150 | $156,950 |
| 2020 | $3,887 | $152,070 | $8,420 | $143,650 |
| 2019 | $3,853 | $145,000 | $4,380 | $140,620 |
| 2018 | $116 | $4,380 | $4,380 | $0 |
| 2017 | $107 | $4,200 | $4,200 | $0 |
| 2016 | $107 | $4,200 | $4,200 | $0 |
| 2015 | -- | $4,030 | $4,030 | $0 |
| 2014 | -- | $4,030 | $4,030 | $0 |
Source: Public Records
Map
Nearby Homes