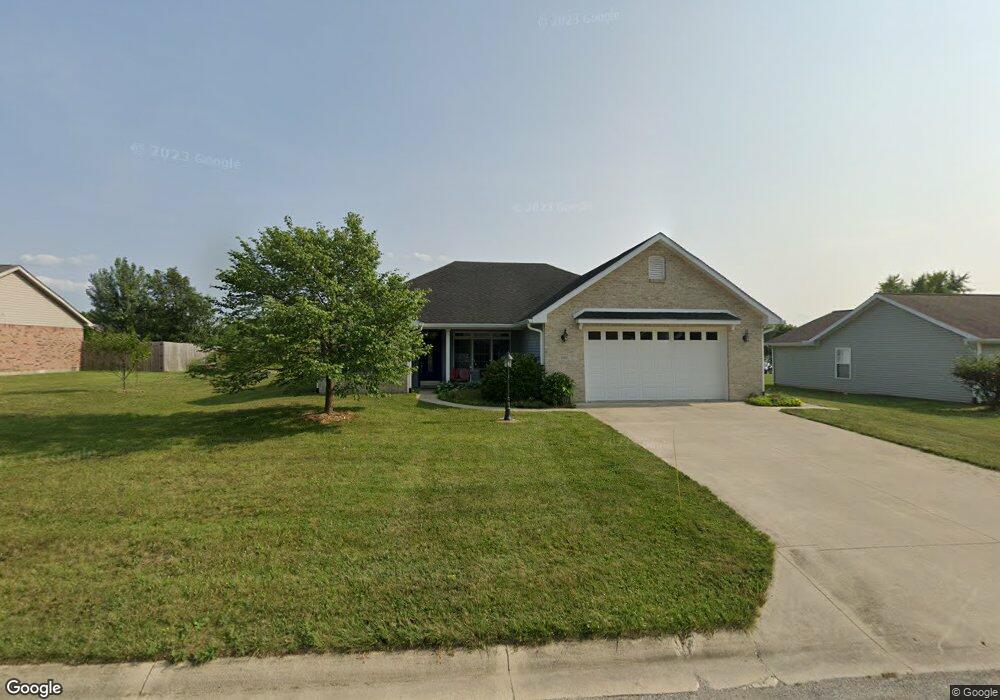
721 W Jefferson St Upland, IN 46989
Estimated Value: $285,000 - $363,000
4
Beds
2
Baths
2,310
Sq Ft
$138/Sq Ft
Est. Value
About This Home
This home is located at 721 W Jefferson St, Upland, IN 46989 and is currently estimated at $317,675, approximately $137 per square foot. 721 W Jefferson St is a home located in Grant County with nearby schools including Eastbrook High School.
Ownership History
Date
Name
Owned For
Owner Type
Purchase Details
Closed on
Mar 26, 2013
Sold by
Knight Thomas R
Bought by
Knight Thomas R and Knight Angela M
Current Estimated Value
Purchase Details
Closed on
Aug 10, 2012
Sold by
Knight Thomas R and Knight Angela M
Bought by
Knight Thomas R
Home Financials for this Owner
Home Financials are based on the most recent Mortgage that was taken out on this home.
Original Mortgage
$159,000
Interest Rate
3.54%
Mortgage Type
New Conventional
Purchase Details
Closed on
Feb 20, 2007
Sold by
Jones Helen L
Bought by
Kright Thomas R and Kright Angelia M
Home Financials for this Owner
Home Financials are based on the most recent Mortgage that was taken out on this home.
Original Mortgage
$165,100
Interest Rate
6.28%
Mortgage Type
New Conventional
Create a Home Valuation Report for This Property
The Home Valuation Report is an in-depth analysis detailing your home's value as well as a comparison with similar homes in the area
Home Values in the Area
Average Home Value in this Area
Purchase History
| Date | Buyer | Sale Price | Title Company |
|---|---|---|---|
| Knight Thomas R | -- | None Available | |
| Knight Thomas R | -- | None Available | |
| Kright Thomas R | -- | None Available |
Source: Public Records
Mortgage History
| Date | Status | Borrower | Loan Amount |
|---|---|---|---|
| Previous Owner | Knight Thomas R | $159,000 | |
| Previous Owner | Kright Thomas R | $165,100 |
Source: Public Records
Tax History Compared to Growth
Tax History
| Year | Tax Paid | Tax Assessment Tax Assessment Total Assessment is a certain percentage of the fair market value that is determined by local assessors to be the total taxable value of land and additions on the property. | Land | Improvement |
|---|---|---|---|---|
| 2024 | $1,784 | $240,200 | $31,600 | $208,600 |
| 2023 | $1,744 | $240,200 | $31,600 | $208,600 |
| 2022 | $1,775 | $218,400 | $20,400 | $198,000 |
| 2021 | $1,583 | $199,100 | $20,400 | $178,700 |
| 2020 | $1,392 | $191,900 | $19,400 | $172,500 |
| 2019 | $1,254 | $185,500 | $19,400 | $166,100 |
| 2018 | $1,116 | $183,200 | $19,400 | $163,800 |
| 2017 | $1,043 | $182,800 | $19,400 | $163,400 |
| 2016 | $1,002 | $184,600 | $19,400 | $165,200 |
| 2014 | $1,023 | $194,400 | $19,400 | $175,000 |
| 2013 | $1,023 | $186,200 | $19,400 | $166,800 |
Source: Public Records
Map
Nearby Homes
- 776 W Harsax Dr
- Lot 8 W South St
- Lot 7 W South St
- Lot 9 W South St
- 328 W Jefferson St
- 0 Catalina Dr
- 158 W Anson St
- 134 E Washington St
- 281 W Taylor Ave
- 2300 S 8th St
- 7960 S 950 E
- 11332 E 600 S
- 8567 S 950 E
- 6644 E 750 S
- 0 S 950 E Unit 202532105
- 3739 S 600 East (Tract 4)
- 400-500 S 1000 E
- 953 Earl Dr
- 0 S 500 E Unit 202537350
- 6611 S 500 E
- 709 W Jefferson St
- 745 W Jefferson St
- 655 W Jefferson St
- 730 W Jefferson St
- 527 S 8th St
- 684 W Jefferson St
- 611 W Jefferson St
- 457 S 8th St
- 595 S 8th St
- 526 S 8th St
- 709 W South St
- 653 W South St
- 593 W Jefferson St
- 629 W South St
- 423 S 8th St
- 639 S 8th St
- 605 W Jefferson St
- 422 S 8th St
- 464 S 8th St
- 794 W South St