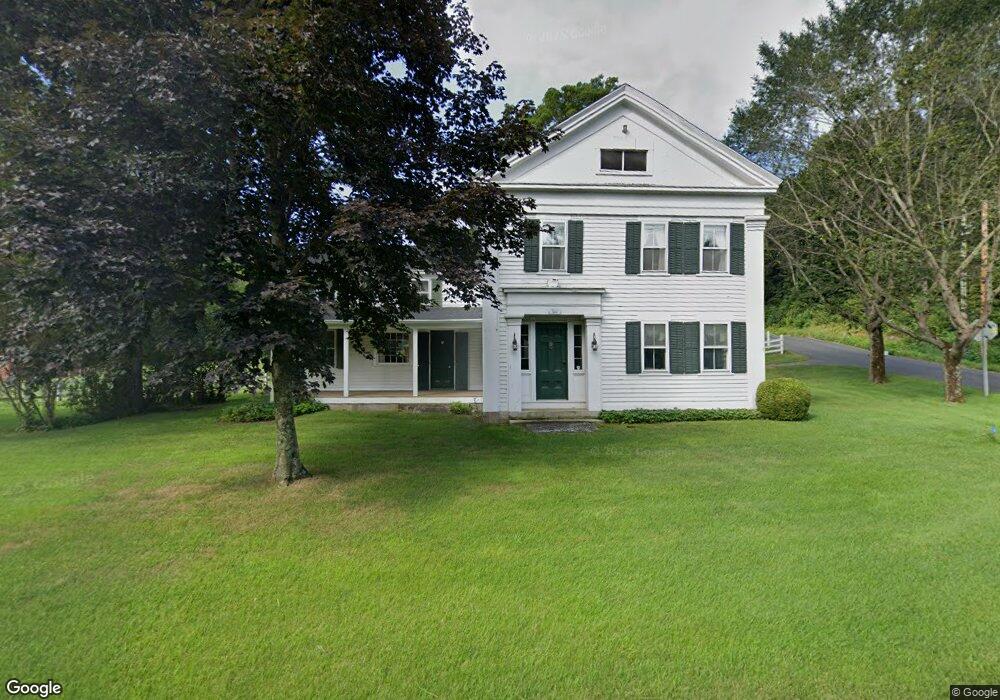
721 Washington Rd Woodbury, CT 06798
Estimated Value: $614,000 - $708,000
4
Beds
3
Baths
2,550
Sq Ft
$255/Sq Ft
Est. Value
About This Home
This home is located at 721 Washington Rd, Woodbury, CT 06798 and is currently estimated at $650,094, approximately $254 per square foot. 721 Washington Rd is a home located in Litchfield County with nearby schools including Mitchell Elementary School, Bethlehem Elementary School, and Woodbury Middle School.
Ownership History
Date
Name
Owned For
Owner Type
Purchase Details
Closed on
Aug 15, 2012
Sold by
Oleary Marta
Bought by
Oleary Brian
Current Estimated Value
Home Financials for this Owner
Home Financials are based on the most recent Mortgage that was taken out on this home.
Original Mortgage
$407,000
Outstanding Balance
$281,420
Interest Rate
3.63%
Estimated Equity
$368,674
Purchase Details
Closed on
Aug 19, 2004
Sold by
Oleary Margaret
Bought by
Oleary Brian and Oleary Marta
Home Financials for this Owner
Home Financials are based on the most recent Mortgage that was taken out on this home.
Original Mortgage
$68,000
Interest Rate
6.03%
Purchase Details
Closed on
Aug 16, 2004
Sold by
Mccrohan Kenneth and Mccrohan Darlene
Bought by
Groh Dawn
Home Financials for this Owner
Home Financials are based on the most recent Mortgage that was taken out on this home.
Original Mortgage
$68,000
Interest Rate
6.03%
Create a Home Valuation Report for This Property
The Home Valuation Report is an in-depth analysis detailing your home's value as well as a comparison with similar homes in the area
Home Values in the Area
Average Home Value in this Area
Purchase History
| Date | Buyer | Sale Price | Title Company |
|---|---|---|---|
| Oleary Brian | -- | -- | |
| Oleary Brian | $425,000 | -- | |
| Groh Dawn | $343,000 | -- |
Source: Public Records
Mortgage History
| Date | Status | Borrower | Loan Amount |
|---|---|---|---|
| Open | Groh Dawn | $407,000 | |
| Previous Owner | Groh Dawn | $68,000 | |
| Previous Owner | Groh Dawn | $276,250 |
Source: Public Records
Tax History Compared to Growth
Tax History
| Year | Tax Paid | Tax Assessment Tax Assessment Total Assessment is a certain percentage of the fair market value that is determined by local assessors to be the total taxable value of land and additions on the property. | Land | Improvement |
|---|---|---|---|---|
| 2025 | $7,779 | $329,350 | $71,960 | $257,390 |
| 2024 | $7,631 | $329,350 | $71,960 | $257,390 |
| 2023 | $6,946 | $239,030 | $71,910 | $167,120 |
| 2022 | $6,973 | $239,030 | $71,910 | $167,120 |
| 2021 | $6,973 | $239,030 | $71,910 | $167,120 |
| 2020 | $5,665 | $239,030 | $71,910 | $167,120 |
| 2019 | $6,973 | $239,030 | $71,910 | $167,120 |
| 2018 | $5,565 | $273,560 | $88,540 | $185,020 |
| 2017 | $7,430 | $273,560 | $88,540 | $185,020 |
| 2016 | $7,192 | $273,560 | $88,540 | $185,020 |
| 2015 | $7,132 | $273,560 | $88,540 | $185,020 |
| 2014 | $7,028 | $273,560 | $88,540 | $185,020 |
Source: Public Records
Map
Nearby Homes
- 242 Tophet Rd
- 31 Holmes Rd
- 174 Weekeepeemee Rd
- 439 Washington Rd
- 38 W Mountain Ln
- 43 Hoop Pole Hill Rd
- 143 Tophet Rd
- 277 Painter Hill Rd
- 298 Railtree Hill Rd
- 359 Nettleton Hollow Rd
- 247 Painter Hill Rd
- 189 Crane Hollow Rd
- 0 Booth Rd
- 202 Crane Hollow Rd
- 0 Good Hill Rd
- 32 Grassy Hill Rd
- 69 Moosehorn Rd
- 35 Weekeepeemee Rd
- 85 Good Hill Rd
- 45 Moosehorn Rd
- 24 Woodside Cir
- 20 Painter Hill Rd
- 15 Painter Hill Rd
- 705 Washington Rd
- 36 Woodside Cir
- 24 Painter Hill Rd
- 20 Woodside Cir
- 231 Sprain Brook Rd
- 27 Woodside Cir
- 5 Woodside Cir
- 225 Sprain Brook Rd
- 741 Washington Rd
- 4 Cross Brook Rd
- 658 Washington Rd
- 37 Woodside Cir
- 760 Washington Rd
- 770 Washington Rd
- 209 Sprain Brook Rd
- 46 Painter Hill Rd
- 16 Cross Brook Rd