Estimated Value: $242,000 - $318,000
2
Beds
1
Bath
768
Sq Ft
$361/Sq Ft
Est. Value
About This Home
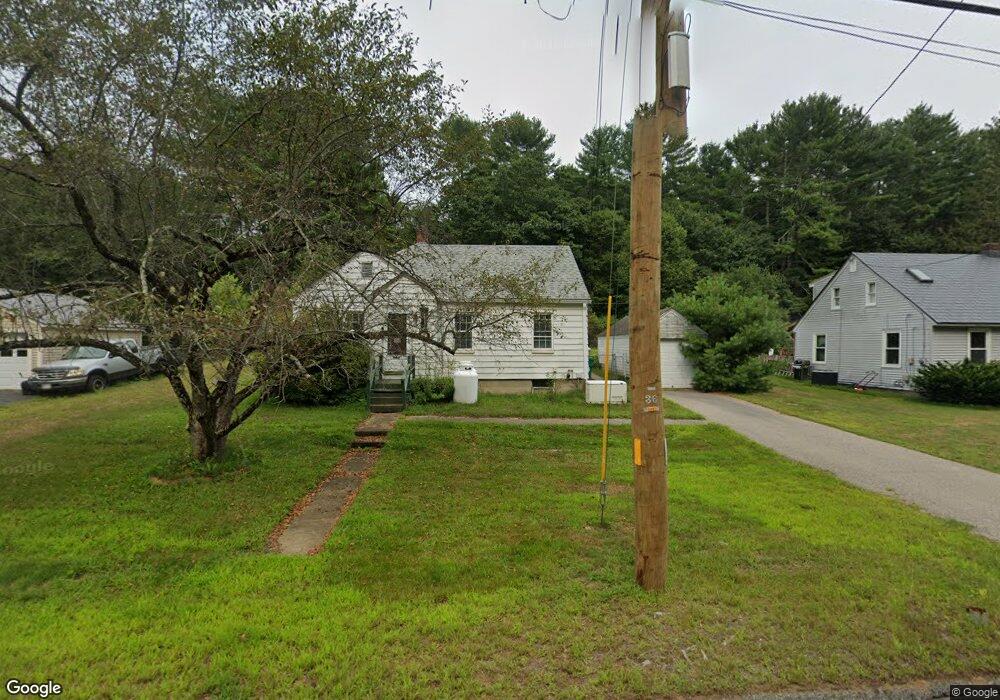
This home is located at 721 Worcester Rd, Barre, MA 01005 and is currently estimated at $277,463, approximately $361 per square foot. 721 Worcester Rd is a home located in Worcester County with nearby schools including Quabbin Regional Middle School and Quabbin Regional High School.
Ownership History
Date
Name
Owned For
Owner Type
Purchase Details
Closed on
Nov 26, 2008
Sold by
Earle Penny L and Mitko Penny L
Bought by
Mitko Joseph and Earle Penny L
Current Estimated Value
Purchase Details
Closed on
Jan 7, 1992
Sold by
Est Eugene J Fargnoli
Bought by
Earle Penny L
Create a Home Valuation Report for This Property
The Home Valuation Report is an in-depth analysis detailing your home's value as well as a comparison with similar homes in the area
Home Values in the Area
Average Home Value in this Area
Purchase History
| Date | Buyer | Sale Price | Title Company |
|---|---|---|---|
| Mitko Joseph | -- | -- | |
| Mitko Joseph | -- | -- | |
| Earle Penny L | $72,500 | -- | |
| Earle Penny L | $72,500 | -- |
Source: Public Records
Mortgage History
| Date | Status | Borrower | Loan Amount |
|---|---|---|---|
| Open | Earle Penny L | $174,847 | |
| Closed | Earle Penny L | $173,165 |
Source: Public Records
Tax History
| Year | Tax Paid | Tax Assessment Tax Assessment Total Assessment is a certain percentage of the fair market value that is determined by local assessors to be the total taxable value of land and additions on the property. | Land | Improvement |
|---|---|---|---|---|
| 2025 | $2,948 | $216,900 | $39,100 | $177,800 |
| 2024 | $2,912 | $208,300 | $37,300 | $171,000 |
| 2023 | $2,834 | $178,700 | $29,000 | $149,700 |
| 2022 | $2,590 | $153,800 | $24,900 | $128,900 |
| 2021 | $2,281 | $126,700 | $24,900 | $101,800 |
| 2020 | $2,194 | $122,800 | $24,900 | $97,900 |
| 2019 | $2,203 | $121,600 | $22,600 | $99,000 |
| 2018 | $2,102 | $111,800 | $22,600 | $89,200 |
| 2017 | $2,016 | $107,800 | $22,600 | $85,200 |
| 2016 | $1,848 | $103,800 | $20,500 | $83,300 |
| 2015 | $1,929 | $103,500 | $27,400 | $76,100 |
| 2014 | $1,661 | $103,400 | $34,100 | $69,300 |
Source: Public Records
Map
Nearby Homes
- 256 Worcester Rd
- 23 Trafalgar Square Unit 23
- 6 Elm St S
- 865 S Barre Rd
- 621 Woods Rd
- 1215 South St
- 141 Peach St
- 38 Edson Rd
- 106 Peach St
- 5 Old Coldbrook Rd
- 0 Station Rd
- 278 Oakham Rd
- 0 Bullard Rd
- 178 James St
- 190 Summer St
- 474 Valley Rd
- 926 Old Turnpike Rd
- 0 Agnese Ct Unit 73478399
- 50 Grove St N
- 15 Primrose Rd
Your Personal Tour Guide
Ask me questions while you tour the home.