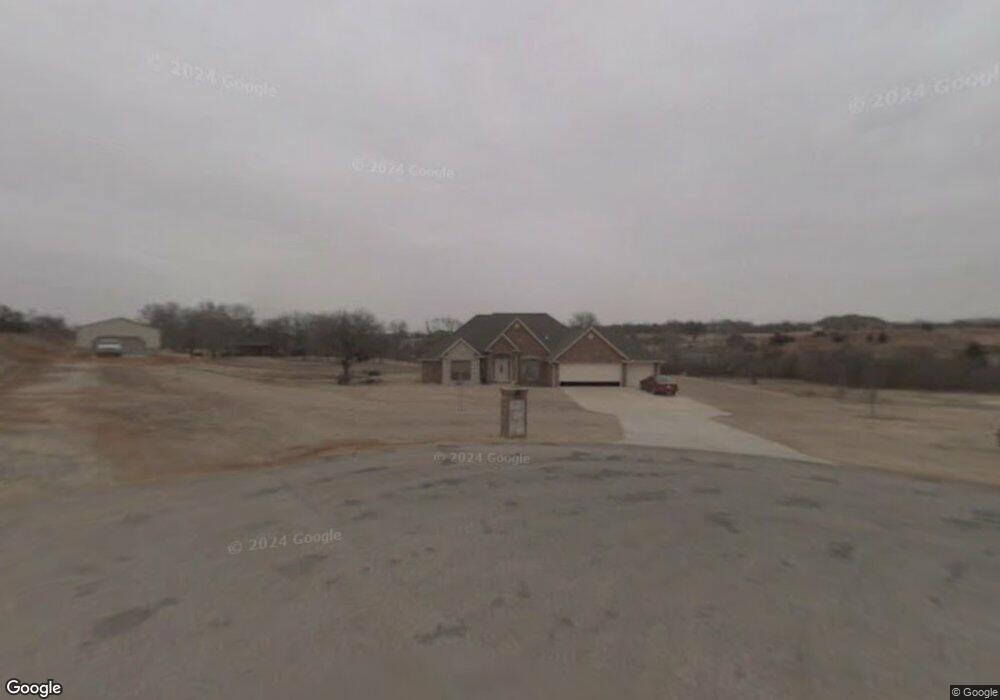
7210 Persimmon Rd Blanchard, OK 73010
Estimated Value: $381,529 - $451,000
3
Beds
3
Baths
2,257
Sq Ft
$188/Sq Ft
Est. Value
About This Home
This home is located at 7210 Persimmon Rd, Blanchard, OK 73010 and is currently estimated at $425,132, approximately $188 per square foot. 7210 Persimmon Rd is a home located in McClain County with nearby schools including Blanchard Elementary School, Blanchard Intermediate School, and Blanchard Middle School.
Ownership History
Date
Name
Owned For
Owner Type
Purchase Details
Closed on
Jan 21, 2013
Sold by
Reeves Steven A and Reeves Linda Jo
Bought by
Worlund Scott and Worlund Kristy
Current Estimated Value
Home Financials for this Owner
Home Financials are based on the most recent Mortgage that was taken out on this home.
Original Mortgage
$210,775
Outstanding Balance
$147,440
Interest Rate
3.5%
Mortgage Type
FHA
Estimated Equity
$277,692
Purchase Details
Closed on
Mar 11, 2005
Sold by
Callhan Wesley R and Callahan Wesley
Bought by
Reeves Steven A and Reeves Linda Jo
Home Financials for this Owner
Home Financials are based on the most recent Mortgage that was taken out on this home.
Original Mortgage
$125,000
Interest Rate
5.67%
Mortgage Type
New Conventional
Purchase Details
Closed on
Jun 23, 2003
Sold by
Blanchard Properties
Bought by
Callahan Wesley R
Create a Home Valuation Report for This Property
The Home Valuation Report is an in-depth analysis detailing your home's value as well as a comparison with similar homes in the area
Home Values in the Area
Average Home Value in this Area
Purchase History
| Date | Buyer | Sale Price | Title Company |
|---|---|---|---|
| Worlund Scott | -- | The Oklahoma City Abstract & | |
| Reeves Steven A | $185,500 | None Available | |
| Callahan Wesley R | $40,000 | -- |
Source: Public Records
Mortgage History
| Date | Status | Borrower | Loan Amount |
|---|---|---|---|
| Open | Worlund Scott | $210,775 | |
| Previous Owner | Reeves Steven A | $125,000 |
Source: Public Records
Tax History
| Year | Tax Paid | Tax Assessment Tax Assessment Total Assessment is a certain percentage of the fair market value that is determined by local assessors to be the total taxable value of land and additions on the property. | Land | Improvement |
|---|---|---|---|---|
| 2025 | $3,285 | $29,743 | $4,206 | $25,537 |
| 2024 | $3,187 | $28,876 | $4,083 | $24,793 |
| 2023 | $3,187 | $28,035 | $3,863 | $24,172 |
| 2022 | $3,002 | $27,219 | $3,630 | $23,589 |
| 2021 | $3,005 | $27,219 | $3,630 | $23,589 |
| 2020 | $3,378 | $26,952 | $3,630 | $23,322 |
| 2019 | $3,338 | $26,166 | $3,630 | $22,536 |
| 2018 | $3,023 | $26,033 | $3,630 | $22,403 |
| 2017 | $3,748 | $29,435 | $3,630 | $25,805 |
| 2016 | $3,397 | $28,577 | $3,630 | $24,947 |
| 2015 | $3,369 | $27,745 | $3,630 | $24,115 |
| 2014 | $3,533 | $27,361 | $3,300 | $24,061 |
Source: Public Records
Map
Nearby Homes
- 1509 Willow Rd
- 8051 Autumn Blaze Dr Unit Lot 11
- 8101 Autumn Blaze Dr Unit Lot 12
- 7219 N Council Ave
- 8302 Autumn Blaze Dr
- 8372 Autumn Blaze Dr Unit L1B4
- 6188 Ward Acres Rd
- 2180 Hilltop Ln
- 2440 SW 24th St
- 140 Meadow Lark Ln
- 201 Meadow Lark Ln
- 240 Meadow Lark Ln
- 488 Fox Den Dr
- 1049 Dorsi Way
- 572 Fox Den Dr
- 541 SE 7th Place
- 3080 Fawn Run
- 300 Turtle Dove Ct
- 870 Pinewood Dr
- 10427 350th St
- 7110 Persimmon Rd
- 7109 Mesa Dr
- 1510 Willow Rd
- 1410 Willow Rd
- 7010 Persimmon Rd
- 7009 Mesa Dr
- 7110 Mesa Dr
- 11520 340th St
- 1409 Willow Rd
- 1610 Willow Rd
- 1609 Willow Rd
- 7311 Lakeview Dr
- 7010 Mesa Dr
- 1410 Blue Bird Manor
- 7411 Lakeview Dr
- 7209 Lakeview Dr
- 1510 Blue Bird Manor
- 1274 NE 70th St
- 7109 Lakeview Dr
- 7310 Lakeview Dr
Your Personal Tour Guide
Ask me questions while you tour the home.