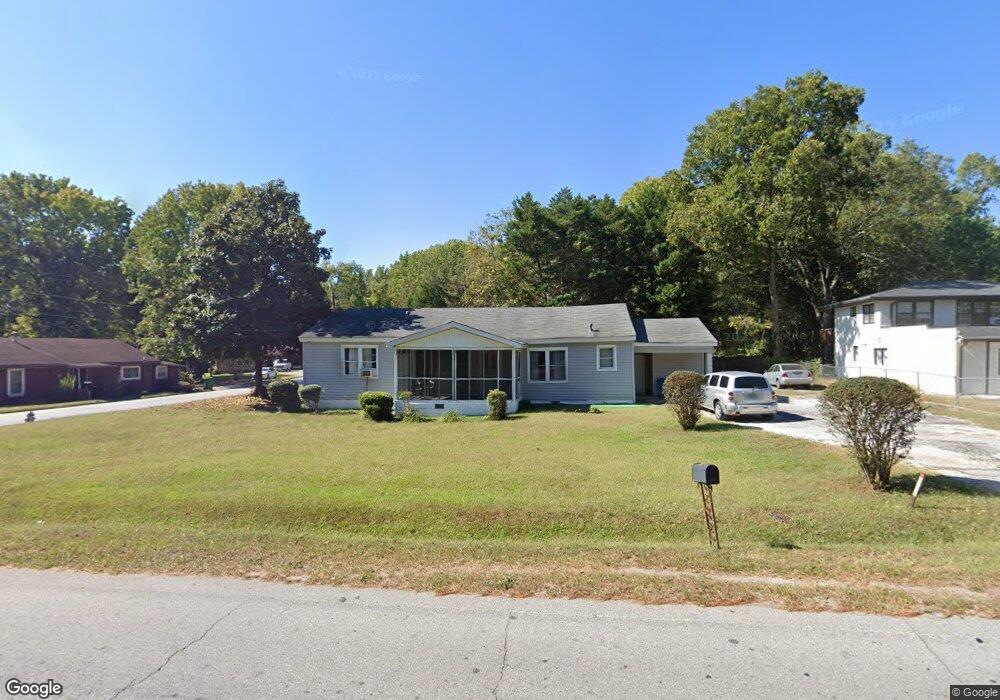
7211 Swift St Lithonia, GA 30058
Estimated Value: $161,000 - $199,000
3
Beds
1
Bath
1,300
Sq Ft
$140/Sq Ft
Est. Value
About This Home
This home is located at 7211 Swift St, Lithonia, GA 30058 and is currently estimated at $181,713, approximately $139 per square foot. 7211 Swift St is a home located in DeKalb County with nearby schools including Stoneview Elementary School, Lithonia Middle School, and Lithonia High School.
Ownership History
Date
Name
Owned For
Owner Type
Purchase Details
Closed on
Apr 5, 2019
Sold by
Daugherty Ricky Lamar
Bought by
Mccollum Freddie L and Mccollum Sarah F
Current Estimated Value
Home Financials for this Owner
Home Financials are based on the most recent Mortgage that was taken out on this home.
Original Mortgage
$63,750
Outstanding Balance
$56,047
Interest Rate
4.4%
Mortgage Type
New Conventional
Estimated Equity
$125,666
Purchase Details
Closed on
Aug 3, 2010
Sold by
Bac Home Loans Servicing Lp
Bought by
Federal Home Loan Mortgage Corporation
Purchase Details
Closed on
Jun 6, 2008
Sold by
Liquidation Properties Inc
Bought by
M & H Ventures Llc
Purchase Details
Closed on
Jun 5, 2008
Sold by
Regions Bk
Bought by
Liquidation Properties Inc
Purchase Details
Closed on
Mar 6, 2007
Sold by
Avery Andrea P
Bought by
Regions Mortgage
Create a Home Valuation Report for This Property
The Home Valuation Report is an in-depth analysis detailing your home's value as well as a comparison with similar homes in the area
Home Values in the Area
Average Home Value in this Area
Purchase History
| Date | Buyer | Sale Price | Title Company |
|---|---|---|---|
| Mccollum Freddie L | $75,000 | -- | |
| Federal Home Loan Mortgage Corporation | -- | -- | |
| Bac Home Loans Servicing Lp | $61,712 | -- | |
| M & H Ventures Llc | $42,000 | -- | |
| Liquidation Properties Inc | -- | -- | |
| Regions Mortgage | $134,817 | -- |
Source: Public Records
Mortgage History
| Date | Status | Borrower | Loan Amount |
|---|---|---|---|
| Open | Mccollum Freddie L | $63,750 | |
| Closed | Mccollum Freddie L | $15,000 |
Source: Public Records
Tax History Compared to Growth
Tax History
| Year | Tax Paid | Tax Assessment Tax Assessment Total Assessment is a certain percentage of the fair market value that is determined by local assessors to be the total taxable value of land and additions on the property. | Land | Improvement |
|---|---|---|---|---|
| 2025 | $607 | $69,880 | $14,400 | $55,480 |
| 2024 | $626 | $67,280 | $14,400 | $52,880 |
| 2023 | $626 | $60,400 | $14,400 | $46,000 |
| 2022 | $526 | $53,800 | $4,800 | $49,000 |
| 2021 | $526 | $41,160 | $4,800 | $36,360 |
| 2020 | $495 | $30,000 | $4,320 | $25,680 |
| 2019 | $1,224 | $20,760 | $4,800 | $15,960 |
| 2018 | $882 | $16,160 | $4,800 | $11,360 |
| 2017 | $862 | $12,000 | $2,640 | $9,360 |
| 2016 | $886 | $12,960 | $2,640 | $10,320 |
| 2014 | $851 | $11,880 | $2,640 | $9,240 |
Source: Public Records
Map
Nearby Homes
- 2706 S Wiggins St
- 7878 Covington Hwy
- 7125 Rhodes St
- 7184 Covington Hwy
- 2751 Cagle St
- 2739 Council St
- 2698 Council St
- 2633 Council St
- 7227 N Mcdaniel St
- 6895 Magnolia St
- 6893 Magnolia St
- 6860 Robinson St
- 6979 Bruce Cir
- 2801 Klondike Rd
- 2523 Bruce St
- 2712 Davidson Dr
- 6860 Parkway Dr
- 6751 Davidson Ct
- 1405 Rock Chapel Rd
- 2760 S Wiggins St
- 7221 Swift St
- 7215 Swift St
- 7195 Swift St
- 7227 Swift St
- 2751 S Wiggins St
- 7189 Swift St
- 2745 S Wiggins St
- 7183 Swift St
- 7235 Swift St
- 7241 Swift St
- 7177 Swift St
- 7247 Swift St
- 7251 Swift St
- 7072 Conyers St
- 7271 Swift St
- 2711 S Wiggins St
- S S Wiggins St
- 2698 S Wiggins St
- 7069 Rhodes St