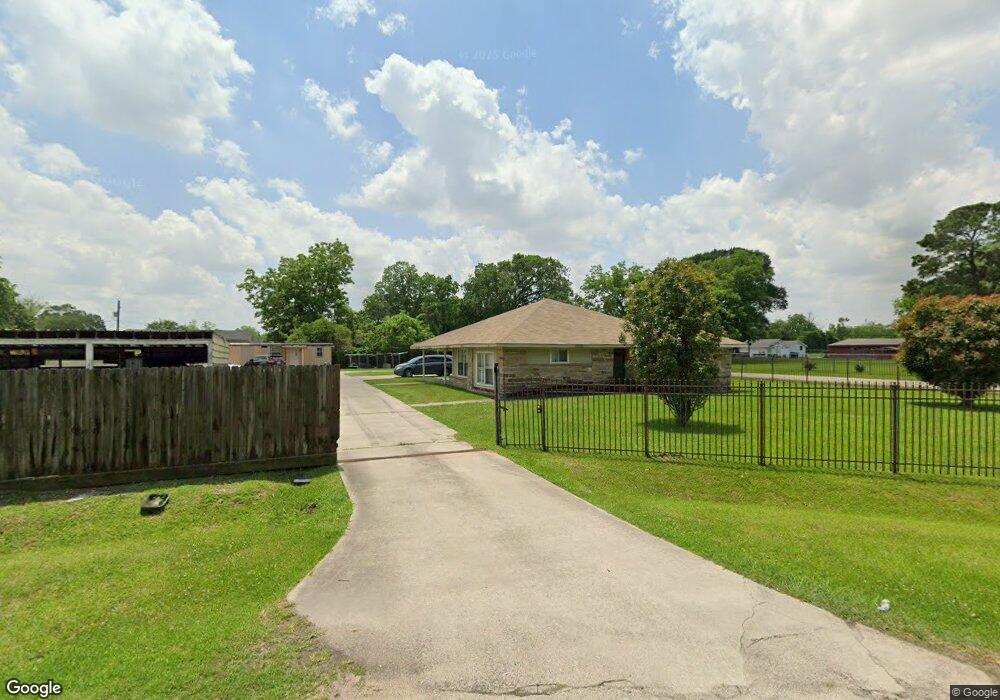
7212 Karnauch Dr Houston, TX 77028
Trinity-Houston Gardens NeighborhoodEstimated Value: $194,000 - $256,000
3
Beds
2
Baths
1,784
Sq Ft
$124/Sq Ft
Est. Value
About This Home
This home is located at 7212 Karnauch Dr, Houston, TX 77028 and is currently estimated at $220,761, approximately $123 per square foot. 7212 Karnauch Dr is a home located in Harris County with nearby schools including McGowen Elementary School, Key Middle, and Kashmere High School.
Ownership History
Date
Name
Owned For
Owner Type
Purchase Details
Closed on
Oct 21, 2005
Sold by
Davis Dennis Lee and Davis Rose Marie
Bought by
Toliver Arthur and Toliver Tony
Current Estimated Value
Home Financials for this Owner
Home Financials are based on the most recent Mortgage that was taken out on this home.
Original Mortgage
$4,850
Interest Rate
5.69%
Mortgage Type
Seller Take Back
Purchase Details
Closed on
Jul 9, 2003
Sold by
Davis James L
Bought by
Davis Dennis Lee and Davis Rose Marie
Home Financials for this Owner
Home Financials are based on the most recent Mortgage that was taken out on this home.
Original Mortgage
$50,400
Interest Rate
5.19%
Mortgage Type
Credit Line Revolving
Purchase Details
Closed on
Aug 1, 2001
Sold by
Davis James L
Bought by
Davis Dennis Lee and Davis Rose Marie
Create a Home Valuation Report for This Property
The Home Valuation Report is an in-depth analysis detailing your home's value as well as a comparison with similar homes in the area
Home Values in the Area
Average Home Value in this Area
Purchase History
| Date | Buyer | Sale Price | Title Company |
|---|---|---|---|
| Toliver Arthur | -- | Texas Nations Title Agency | |
| Davis Dennis Lee | -- | Fidelity National Title | |
| Davis James L | -- | Fidelity National Title | |
| Davis Dennis Lee | -- | -- |
Source: Public Records
Mortgage History
| Date | Status | Borrower | Loan Amount |
|---|---|---|---|
| Closed | Toliver Arthur | $4,850 | |
| Previous Owner | Davis Dennis Lee | $50,400 |
Source: Public Records
Tax History Compared to Growth
Tax History
| Year | Tax Paid | Tax Assessment Tax Assessment Total Assessment is a certain percentage of the fair market value that is determined by local assessors to be the total taxable value of land and additions on the property. | Land | Improvement |
|---|---|---|---|---|
| 2025 | $1,182 | $213,286 | $68,859 | $144,427 |
| 2024 | $1,182 | $185,812 | $62,249 | $123,563 |
| 2023 | $1,182 | $150,431 | $55,088 | $95,343 |
| 2022 | $2,190 | $122,094 | $38,561 | $83,533 |
| 2021 | $2,107 | $92,907 | $24,239 | $68,668 |
| 2020 | $1,990 | $92,907 | $24,239 | $68,668 |
| 2019 | $1,891 | $92,907 | $24,239 | $68,668 |
| 2018 | $1,080 | $68,711 | $24,239 | $44,472 |
| 2017 | $1,562 | $68,711 | $24,239 | $44,472 |
| 2016 | $1,420 | $68,711 | $24,239 | $44,472 |
| 2015 | $779 | $59,498 | $4,842 | $54,656 |
| 2014 | $779 | $59,498 | $4,842 | $54,656 |
Source: Public Records
Map
Nearby Homes
- 7204 Homestead Rd
- 0 Kittridge
- 6909 Kittridge St
- 7015 Elbert St
- 7123 Saint Louis St
- 0 Kellett St Unit 85066707
- 0 Glen Manor Dr Unit 10745202
- 7140 Orville St
- 6911 Finch St
- 7325 Ley Rd
- 6907 Finch St
- 7327 Ley Rd
- 7309 Orville St
- 7502 Ley Rd
- 0 Landor
- 6908 Larkstone St
- 6729 Kittridge St
- 6714 E Crosstimbers
- 6842 Carothers St
- 6838 Carothers St
- 7205 Banyan St
- 7209 Banyan St
- 7213 Karnauch Dr
- 7211 Karnauch Dr
- 7211 Karnauch Dr
- 7211 Darien St
- 7213 1/2 Karnauch Dr
- 7215 Banyan St
- 7125 Banyan St
- 7223 Darien St
- 7226 Finch St
- 7130 Banyan St
- 7126 Banyan St
- 7323 Darien St
- 7228 Darien St
- 7212 Darien St
- 7117 Darien St
- 7303 Banyan St
- 7327 Darien St
- 7306 Darien St