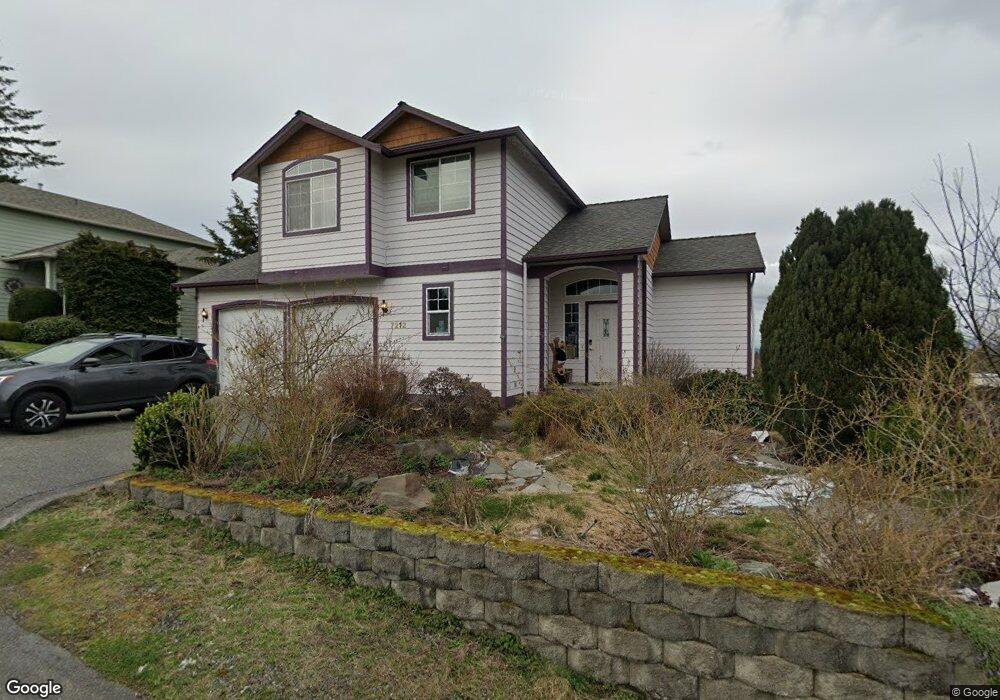
7212 Upper Ridge Rd Everett, WA 98203
Evergreen NeighborhoodEstimated Value: $689,439 - $746,000
3
Beds
3
Baths
1,692
Sq Ft
$432/Sq Ft
Est. Value
About This Home
This home is located at 7212 Upper Ridge Rd, Everett, WA 98203 and is currently estimated at $730,610, approximately $431 per square foot. 7212 Upper Ridge Rd is a home located in Snohomish County with nearby schools including Horizon Elementary School, Olympic View Middle School, and Mariner High School.
Ownership History
Date
Name
Owned For
Owner Type
Purchase Details
Closed on
Dec 3, 2004
Sold by
Mineer Lloyd G and Mineer Mavis Fredrickson
Bought by
Mahoney John M and Mahoney Gloria
Current Estimated Value
Home Financials for this Owner
Home Financials are based on the most recent Mortgage that was taken out on this home.
Original Mortgage
$264,000
Outstanding Balance
$131,419
Interest Rate
5.64%
Mortgage Type
Unknown
Estimated Equity
$599,192
Purchase Details
Closed on
Apr 27, 1998
Sold by
Young John D and Young Diane S
Bought by
Mineer Lloyd G and Frederickson Mineer Mavis
Home Financials for this Owner
Home Financials are based on the most recent Mortgage that was taken out on this home.
Original Mortgage
$176,160
Interest Rate
7.06%
Purchase Details
Closed on
Aug 7, 1996
Sold by
Autumn Development Inc
Bought by
Young John D and Young Diane S
Home Financials for this Owner
Home Financials are based on the most recent Mortgage that was taken out on this home.
Original Mortgage
$165,300
Interest Rate
8.18%
Create a Home Valuation Report for This Property
The Home Valuation Report is an in-depth analysis detailing your home's value as well as a comparison with similar homes in the area
Home Values in the Area
Average Home Value in this Area
Purchase History
| Date | Buyer | Sale Price | Title Company |
|---|---|---|---|
| Mahoney John M | $330,000 | Stewart | |
| Mineer Lloyd G | $220,200 | Chicago Title Insurance Co | |
| Young John D | $174,000 | First American Title |
Source: Public Records
Mortgage History
| Date | Status | Borrower | Loan Amount |
|---|---|---|---|
| Open | Mahoney John M | $264,000 | |
| Previous Owner | Mineer Lloyd G | $176,160 | |
| Previous Owner | Young John D | $165,300 | |
| Closed | Mahoney John M | $66,000 |
Source: Public Records
Tax History
| Year | Tax Paid | Tax Assessment Tax Assessment Total Assessment is a certain percentage of the fair market value that is determined by local assessors to be the total taxable value of land and additions on the property. | Land | Improvement |
|---|---|---|---|---|
| 2025 | $4,745 | $622,500 | $378,000 | $244,500 |
| 2024 | $4,745 | $597,700 | $353,200 | $244,500 |
| 2023 | $5,455 | $704,900 | $422,400 | $282,500 |
| 2022 | $5,163 | $577,500 | $317,500 | $260,000 |
| 2020 | $4,018 | $450,700 | $228,900 | $221,800 |
| 2019 | $3,773 | $427,700 | $208,200 | $219,500 |
| 2018 | $3,941 | $385,500 | $187,500 | $198,000 |
| 2017 | $3,689 | $368,000 | $182,000 | $186,000 |
| 2016 | $3,508 | $346,100 | $161,000 | $185,100 |
Source: Public Records
Map
Nearby Homes
- 501 75th Place SW
- 6916 Beverly Ln
- 323 75th St SE Unit A14
- 323 75th St SE Unit B10
- 7525 Beverly Ln
- 7910 E Glen Dr
- 615 75th St SE Unit C53
- 615 75th St SE Unit C52
- 747 75th St SE Unit B203
- 820 Cady Rd Unit H304
- 820 Cady Rd Unit B305
- 820 Cady Rd Unit F103
- 126 W Casino Rd Unit 5
- 6705 Cady Rd
- 6518 Cady Rd
- 1001 W Casino Rd Unit C201
- 1001 W Casino Rd Unit A303
- 5909 Glenwood Ave
- 7027 Rainier Dr Unit E
- 7027 Rainier Dr Unit G
- 7216 Upper Ridge Rd
- 7208 Upper Ridge Rd
- 215 73rd St SW
- 209 73rd St SW
- 221 73rd St SW
- 203 73rd St SW
- 301 73rd St SW
- 7203 Upper Ridge Rd
- 307 73rd St SW
- 216 73rd St SW
- 210 73rd St SW
- 7219 Upper Ridge Rd
- 222 73rd St SW
- 204 73rd St SW
- 7227 Upper Ridge Rd
- 302 73rd St SW
- 313 73rd St SW
- 308 73rd St SW
- 7207 Upper Ridge Rd
- 7309 Upper Ridge Rd
Your Personal Tour Guide
Ask me questions while you tour the home.