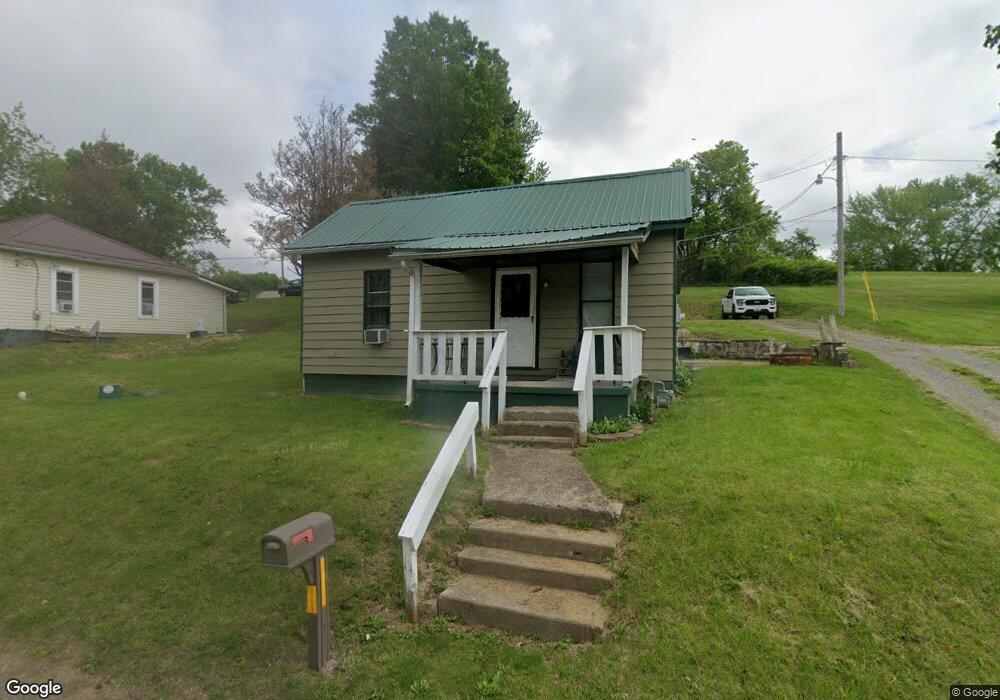
7213 Bloomfield Rd Cambridge, OH 43725
Estimated Value: $88,912 - $146,000
3
Beds
1
Bath
1,040
Sq Ft
$116/Sq Ft
Est. Value
About This Home
This home is located at 7213 Bloomfield Rd, Cambridge, OH 43725 and is currently estimated at $120,228, approximately $115 per square foot. 7213 Bloomfield Rd is a home located in Guernsey County with nearby schools including Cambridge High School, Foxfire East Academy, and St. Benedict Elementary School.
Ownership History
Date
Name
Owned For
Owner Type
Purchase Details
Closed on
Jul 26, 2019
Sold by
Bradford Chester
Bought by
Bradford Derek
Current Estimated Value
Purchase Details
Closed on
Jun 14, 2019
Sold by
County Of Guernsey
Bought by
Bradford Chester
Purchase Details
Closed on
Dec 28, 2012
Sold by
Sunshine Rental Of Ohio Inc
Bought by
Downtown Rentals Of Cambridge Inc
Purchase Details
Closed on
Nov 2, 2011
Sold by
Becker Deborah L
Bought by
Sunshine Rental Of Ohio Inc
Purchase Details
Closed on
Nov 4, 2005
Sold by
Mcclelland Dorothy V and Mcclelland Debra I
Bought by
Becker Deborah L
Home Financials for this Owner
Home Financials are based on the most recent Mortgage that was taken out on this home.
Original Mortgage
$26,600
Interest Rate
7.75%
Mortgage Type
Adjustable Rate Mortgage/ARM
Create a Home Valuation Report for This Property
The Home Valuation Report is an in-depth analysis detailing your home's value as well as a comparison with similar homes in the area
Home Values in the Area
Average Home Value in this Area
Purchase History
| Date | Buyer | Sale Price | Title Company |
|---|---|---|---|
| Bradford Derek | -- | None Available | |
| Bradford Chester | $5,100 | None Available | |
| Downtown Rentals Of Cambridge Inc | $5,000 | None Available | |
| Sunshine Rental Of Ohio Inc | $3,000 | None Available | |
| Becker Deborah L | $28,000 | -- |
Source: Public Records
Mortgage History
| Date | Status | Borrower | Loan Amount |
|---|---|---|---|
| Previous Owner | Becker Deborah L | $26,600 |
Source: Public Records
Tax History
| Year | Tax Paid | Tax Assessment Tax Assessment Total Assessment is a certain percentage of the fair market value that is determined by local assessors to be the total taxable value of land and additions on the property. | Land | Improvement |
|---|---|---|---|---|
| 2025 | $746 | $16,583 | $3,521 | $13,062 |
| 2024 | $748 | $16,583 | $3,521 | $13,062 |
| 2023 | $726 | $13,283 | $2,793 | $10,490 |
| 2022 | $628 | $13,270 | $2,780 | $10,490 |
| 2021 | $621 | $13,270 | $2,780 | $10,490 |
| 2020 | $608 | $11,820 | $2,250 | $9,570 |
| 2019 | $0 | $9,160 | $1,630 | $7,530 |
| 2018 | $488 | $11,820 | $2,250 | $9,570 |
| 2017 | $588 | $10,230 | $1,950 | $8,280 |
| 2016 | $457 | $10,230 | $1,950 | $8,280 |
| 2015 | $568 | $10,230 | $1,950 | $8,280 |
| 2014 | -- | $10,320 | $1,710 | $8,610 |
| 2013 | $5,050 | $10,320 | $1,710 | $8,610 |
Source: Public Records
Map
Nearby Homes
- 7201 Bloomfield Rd
- 7192 Bloomfield Rd
- 7206 Bloomfield Rd
- 63821 Ridgeway Rd
- 63891 Ridgeway Rd
- 7180 Bloomfield Rd
- 7236 Bloomfield Rd
- 7173 Bloomfield Rd
- 7174 Bloomfield Rd
- 63850 Ridgeway Rd
- 7152 Bloomfield Rd
- 7244 Bloomfield Rd
- 7167 Bloomfield Rd
- 63939 Ridgeway Rd
- 7253 Huntsman Rd
- 7274 Bloomfield Rd
- 7148 Bloomfield Rd
- 63922 Ridgeway Rd
- 7246 Huntsman Rd
- 7145 Bloomfield Rd
Your Personal Tour Guide
Ask me questions while you tour the home.