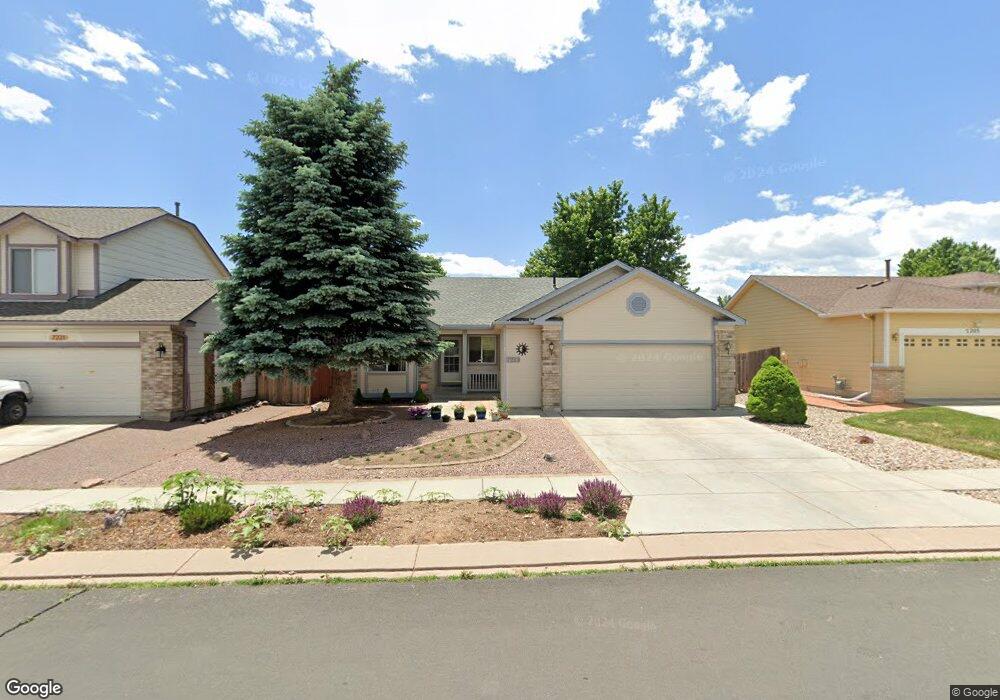
7213 Campstool Dr Colorado Springs, CO 80922
Springs Ranch NeighborhoodEstimated Value: $401,401 - $435,000
3
Beds
1
Bath
1,234
Sq Ft
$338/Sq Ft
Est. Value
About This Home
This home is located at 7213 Campstool Dr, Colorado Springs, CO 80922 and is currently estimated at $416,600, approximately $337 per square foot. 7213 Campstool Dr is a home located in El Paso County with nearby schools including Springs Ranch Elementary School, Horizon Middle School, and Sand Creek High School.
Ownership History
Date
Name
Owned For
Owner Type
Purchase Details
Closed on
Mar 11, 2022
Sold by
Guillen Salvador F
Bought by
Mock Kevin and Mock Christy
Current Estimated Value
Home Financials for this Owner
Home Financials are based on the most recent Mortgage that was taken out on this home.
Original Mortgage
$230,000
Outstanding Balance
$214,894
Interest Rate
3.92%
Mortgage Type
New Conventional
Estimated Equity
$201,706
Purchase Details
Closed on
Apr 18, 2018
Sold by
Clausen Shirley A
Bought by
Guillen Salvador F and Guillen Utona L
Home Financials for this Owner
Home Financials are based on the most recent Mortgage that was taken out on this home.
Original Mortgage
$255,000
Interest Rate
4.46%
Mortgage Type
VA
Purchase Details
Closed on
Nov 7, 2002
Sold by
Elite Properties Of America Inc
Bought by
Clausen Richard L and Clausen Shirley A
Home Financials for this Owner
Home Financials are based on the most recent Mortgage that was taken out on this home.
Original Mortgage
$154,400
Interest Rate
5.75%
Create a Home Valuation Report for This Property
The Home Valuation Report is an in-depth analysis detailing your home's value as well as a comparison with similar homes in the area
Home Values in the Area
Average Home Value in this Area
Purchase History
| Date | Buyer | Sale Price | Title Company |
|---|---|---|---|
| Mock Kevin | -- | Stewart Title Company | |
| Guillen Salvador F | $256,500 | Fidelity National Title | |
| Clausen Richard L | $149,808 | Land Title |
Source: Public Records
Mortgage History
| Date | Status | Borrower | Loan Amount |
|---|---|---|---|
| Open | Mock Kevin | $230,000 | |
| Previous Owner | Guillen Salvador F | $255,000 | |
| Previous Owner | Clausen Richard L | $154,400 | |
| Closed | Clausen Richard L | $36,000 |
Source: Public Records
Tax History Compared to Growth
Tax History
| Year | Tax Paid | Tax Assessment Tax Assessment Total Assessment is a certain percentage of the fair market value that is determined by local assessors to be the total taxable value of land and additions on the property. | Land | Improvement |
|---|---|---|---|---|
| 2025 | $1,455 | $28,710 | -- | -- |
| 2024 | $1,356 | $28,400 | $4,620 | $23,780 |
| 2023 | $1,356 | $28,400 | $4,620 | $23,780 |
| 2022 | $1,158 | $19,860 | $4,170 | $15,690 |
| 2021 | $1,207 | $20,430 | $4,290 | $16,140 |
| 2020 | $1,037 | $17,340 | $3,580 | $13,760 |
| 2019 | $1,025 | $17,340 | $3,580 | $13,760 |
| 2018 | $427 | $14,170 | $3,020 | $11,150 |
| 2017 | $429 | $14,170 | $3,020 | $11,150 |
| 2016 | $441 | $14,340 | $2,950 | $11,390 |
| 2015 | $442 | $14,340 | $2,950 | $11,390 |
| 2014 | $400 | $12,730 | $2,790 | $9,940 |
Source: Public Records
Map
Nearby Homes
- 4144 Poplar Brook Dr
- 7215 Amber Ridge Dr
- 4126 Fellsland Dr
- 4404 Poplar Brook Dr
- 4013 Pronghorn Meadows Cir
- 4148 Heathmoor Dr
- 3850 Springs Ranch Dr
- 4269 Centerville Dr
- 4325 Crow Creek Dr
- 3880 Happy Jack Dr
- 4019 Roan Dr
- 4307 Addax Ct
- 4352 Canteen Trail
- 3866 Papuan Dr
- 3777 Swainson Dr
- 3865 Falconry Dr
- Trinity Plan at Windermere - 3500 Series
- 4216 Gray Fox Heights
- 4174 Gray Fox Heights
- 4029 Ryedale Way
- 7221 Campstool Dr
- 7205 Campstool Dr
- 7229 Campstool Dr
- 4132 Happy Jack Dr
- 4126 Happy Jack Dr
- 4138 Happy Jack Dr
- 4211 Pioneer Creek Dr
- 4120 Happy Jack Dr
- 7222 Campstool Dr
- 7237 Campstool Dr
- 7230 Campstool Dr
- 4114 Happy Jack Dr
- 4239 Pioneer Creek Dr
- 4140 Pioneer Creek Dr
- 4182 Pioneer Creek Dr
- 7245 Campstool Dr
- 4122 Pioneer Creek Dr
- 7238 Campstool Dr
- 4196 Pioneer Creek Dr
- 4108 Happy Jack Dr