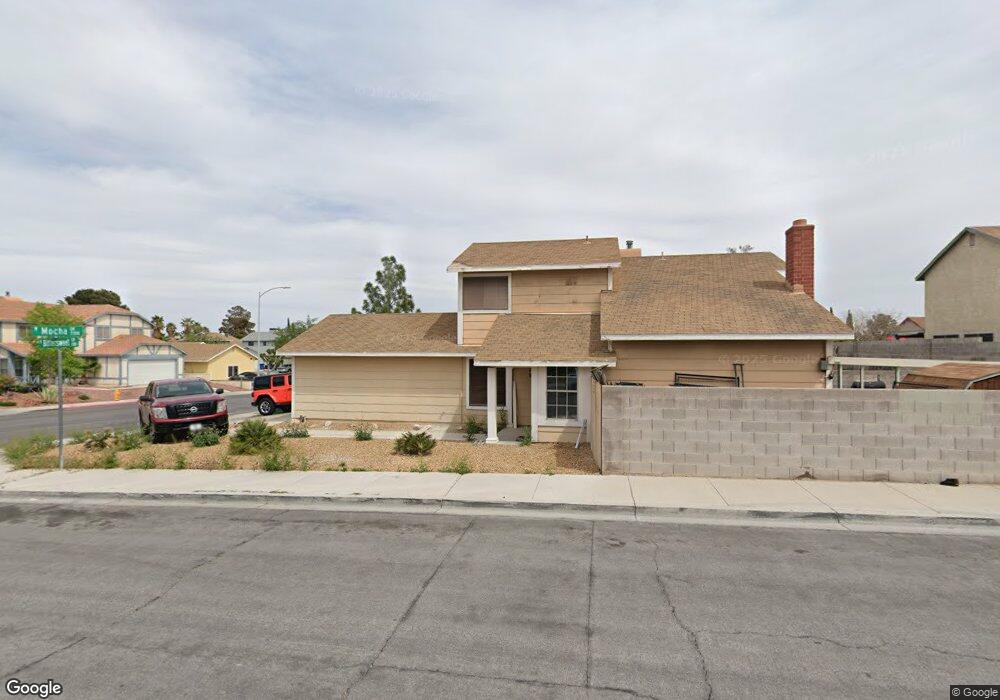
7213 Mocha Dr Unit none Las Vegas, NV 89128
Pioneer Park NeighborhoodEstimated Value: $394,024 - $422,000
3
Beds
2
Baths
1,508
Sq Ft
$272/Sq Ft
Est. Value
About This Home
This home is located at 7213 Mocha Dr Unit none, Las Vegas, NV 89128 and is currently estimated at $410,506, approximately $272 per square foot. 7213 Mocha Dr Unit none is a home located in Clark County with nearby schools including James B. McMillan Elementary School, Edythe & Lloyd Katz Elementary School, and Ernest Becker Middle School.
Ownership History
Date
Name
Owned For
Owner Type
Purchase Details
Closed on
Apr 14, 2022
Sold by
Perrotti Jr Joseph C
Bought by
Salinas Maria
Current Estimated Value
Home Financials for this Owner
Home Financials are based on the most recent Mortgage that was taken out on this home.
Original Mortgage
$244,200
Outstanding Balance
$228,374
Interest Rate
4.16%
Mortgage Type
New Conventional
Estimated Equity
$182,132
Purchase Details
Closed on
Feb 22, 2018
Sold by
Obladen Philippe
Bought by
Perrotti Joseph C
Home Financials for this Owner
Home Financials are based on the most recent Mortgage that was taken out on this home.
Original Mortgage
$240,000
Interest Rate
4.32%
Mortgage Type
VA
Purchase Details
Closed on
Sep 4, 2013
Sold by
J Glen Properties L L C
Bought by
Obladen Phillippe
Purchase Details
Closed on
Jan 15, 2013
Sold by
Mtc Financial Inc
Bought by
J Glen Properties
Create a Home Valuation Report for This Property
The Home Valuation Report is an in-depth analysis detailing your home's value as well as a comparison with similar homes in the area
Home Values in the Area
Average Home Value in this Area
Purchase History
| Date | Buyer | Sale Price | Title Company |
|---|---|---|---|
| Salinas Maria | $407,000 | Lawyers Title | |
| Perrotti Joseph C | $240,000 | Wfg National Title Company | |
| Obladen Phillippe | $160,000 | National Title Co | |
| J Glen Properties | $115,000 | National Title Co |
Source: Public Records
Mortgage History
| Date | Status | Borrower | Loan Amount |
|---|---|---|---|
| Open | Salinas Maria | $244,200 | |
| Previous Owner | Perrotti Joseph C | $240,000 |
Source: Public Records
Tax History Compared to Growth
Tax History
| Year | Tax Paid | Tax Assessment Tax Assessment Total Assessment is a certain percentage of the fair market value that is determined by local assessors to be the total taxable value of land and additions on the property. | Land | Improvement |
|---|---|---|---|---|
| 2025 | $1,662 | $71,848 | $29,750 | $42,098 |
| 2024 | $1,539 | $71,848 | $29,750 | $42,098 |
| 2023 | $1,539 | $69,059 | $28,350 | $40,709 |
| 2022 | $1,426 | $60,623 | $22,750 | $37,873 |
| 2021 | $4,039 | $57,094 | $20,650 | $36,444 |
| 2020 | $1,223 | $56,541 | $19,950 | $36,591 |
| 2019 | $1,146 | $52,839 | $16,450 | $36,389 |
| 2018 | $1,094 | $50,428 | $15,050 | $35,378 |
| 2017 | $1,648 | $50,284 | $14,000 | $36,284 |
| 2016 | $1,025 | $46,641 | $9,800 | $36,841 |
| 2015 | $1,022 | $44,002 | $8,750 | $35,252 |
| 2014 | $990 | $31,471 | $5,250 | $26,221 |
Source: Public Records
Map
Nearby Homes
- 7037 Brown Derby Cir
- 7104 Carmen Blvd
- 1320 Rainbow Meadows Dr
- 7113 Carrondale Way
- 7228 Single Pine Dr
- 1624 Leaning Pine Way
- 7405 Saybrook Point Dr
- 1636 Royal Palm Dr
- 925 Willow Tree Dr Unit B
- 1009 Willow Tree Dr Unit C
- 1028 Willow Tree Dr Unit D
- 1009 Pagosa Way
- 1605 Palmales Ct
- 1105 Olvera Way
- 1017 Willow Tree Dr Unit C
- 7201 Alamosa Way
- 7321 Summer Sun Dr
- 1620 Palmae Way
- 7400 Queen Palm Dr
- 1428 Pacific Terrace Dr
- 7213 Mocha Dr
- 7209 Mocha Dr
- 1329 Bittersweet Cir
- 7205 Mocha Dr
- 1325 Bittersweet Cir
- 1336 Bittersweet Cir
- 1340 Bittersweet Cir
- 7201 Mocha Dr
- 1332 Bittersweet Cir
- 1324 Wintergreen Dr
- 7208 Mocha Dr
- 1328 Bittersweet Cir
- 7212 Mocha Dr
- 1321 Bittersweet Cir
- 7204 Mocha Dr
- 7216 Mocha Dr Unit n/a
- 7216 Mocha Dr
- 1320 Wintergreen Dr
- 1324 Bittersweet Cir
- 7200 Mocha Dr