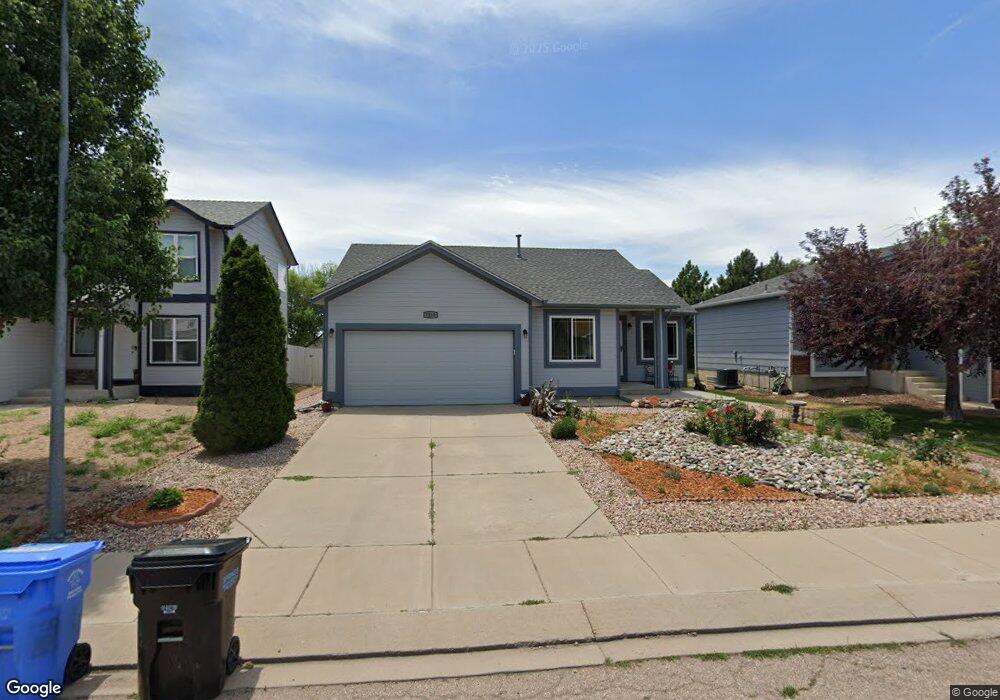
7213 Moss Bluff Ct Fountain, CO 80817
North Fountain Valley NeighborhoodEstimated Value: $349,467 - $370,000
3
Beds
2
Baths
1,000
Sq Ft
$360/Sq Ft
Est. Value
About This Home
This home is located at 7213 Moss Bluff Ct, Fountain, CO 80817 and is currently estimated at $360,367, approximately $360 per square foot. 7213 Moss Bluff Ct is a home located in El Paso County with nearby schools including Eagleside Elementary School, Fountain Middle School, and Fountain-Fort Carson High School.
Ownership History
Date
Name
Owned For
Owner Type
Purchase Details
Closed on
Aug 3, 2018
Sold by
Klaric George S and Klaric Sheliea L
Bought by
Feldy Maxine
Current Estimated Value
Home Financials for this Owner
Home Financials are based on the most recent Mortgage that was taken out on this home.
Original Mortgage
$141,000
Outstanding Balance
$122,453
Interest Rate
4.5%
Mortgage Type
New Conventional
Estimated Equity
$237,914
Purchase Details
Closed on
May 28, 2004
Sold by
The Rocky Mountain Home Co Llc
Bought by
Klaric George S and Klaric Shelia L
Home Financials for this Owner
Home Financials are based on the most recent Mortgage that was taken out on this home.
Original Mortgage
$118,960
Interest Rate
5.75%
Mortgage Type
Unknown
Purchase Details
Closed on
May 13, 2004
Sold by
Wi Investment Co Llc
Bought by
Rocky Mountain Home Co Llc
Home Financials for this Owner
Home Financials are based on the most recent Mortgage that was taken out on this home.
Original Mortgage
$118,960
Interest Rate
5.75%
Mortgage Type
Unknown
Create a Home Valuation Report for This Property
The Home Valuation Report is an in-depth analysis detailing your home's value as well as a comparison with similar homes in the area
Home Values in the Area
Average Home Value in this Area
Purchase History
| Date | Buyer | Sale Price | Title Company |
|---|---|---|---|
| Feldy Maxine | $235,000 | Guardian Title | |
| Klaric George S | $148,700 | Stewart Title | |
| Rocky Mountain Home Co Llc | $139,740 | Stewart Title |
Source: Public Records
Mortgage History
| Date | Status | Borrower | Loan Amount |
|---|---|---|---|
| Open | Feldy Maxine | $141,000 | |
| Previous Owner | Klaric George S | $118,960 | |
| Closed | Klaric George S | $29,740 |
Source: Public Records
Tax History Compared to Growth
Tax History
| Year | Tax Paid | Tax Assessment Tax Assessment Total Assessment is a certain percentage of the fair market value that is determined by local assessors to be the total taxable value of land and additions on the property. | Land | Improvement |
|---|---|---|---|---|
| 2025 | $1,219 | $23,230 | -- | -- |
| 2024 | $1,071 | $23,980 | $4,340 | $19,640 |
| 2022 | $957 | $16,400 | $3,430 | $12,970 |
| 2021 | $889 | $16,870 | $3,530 | $13,340 |
| 2020 | $793 | $14,730 | $3,090 | $11,640 |
| 2019 | $777 | $14,730 | $3,090 | $11,640 |
| 2018 | $672 | $12,300 | $3,110 | $9,190 |
| 2017 | $664 | $12,300 | $3,110 | $9,190 |
| 2016 | $622 | $11,510 | $3,220 | $8,290 |
| 2015 | $623 | $11,510 | $3,220 | $8,290 |
| 2014 | $593 | $11,010 | $3,220 | $7,790 |
Source: Public Records
Map
Nearby Homes
- 1355 Fountain Mesa Rd
- 7166 Araia Dr
- 570 Calle Entrada
- 1034 Fountain Mesa Rd
- 7069 Reunion Cir
- 510 Avenida Del Cielo
- 440 Calle Entrada
- 7326 Legacy Point
- 7110 Lake Ave
- 9491 Mosaic Heights
- 7327 Willow Pines Place
- 1509 Monterey Way
- 803 Ridgebury Place
- 100 Fence Post Ct
- 7081 Ancestra Dr
- 806 Desert Cir
- 845 Desert Cir
- 6969 Ancestra Dr
- 842 Desert Cir
- 7370 Tributary Ct
- 7217 Moss Bluff Ct
- 7209 Moss Bluff Ct
- 7221 Moss Bluff Ct
- 7205 Moss Bluff Ct
- 7225 Moss Bluff Ct
- 7214 Moss Bluff Ct
- 7218 Moss Bluff Ct
- 7210 Moss Bluff Ct
- 7222 Moss Bluff Ct
- 7229 Moss Bluff Ct
- 7206 Moss Bluff Ct
- 7226 Moss Bluff Ct
- 7202 Moss Bluff Ct
- 1142 Fountain Mesa Rd
- 7233 Moss Bluff Ct
- 7230 Moss Bluff Ct
- 7234 Moss Bluff Ct
- 7127 Araia Dr
- 7135 Araia Dr
- 7119 Araia Dr