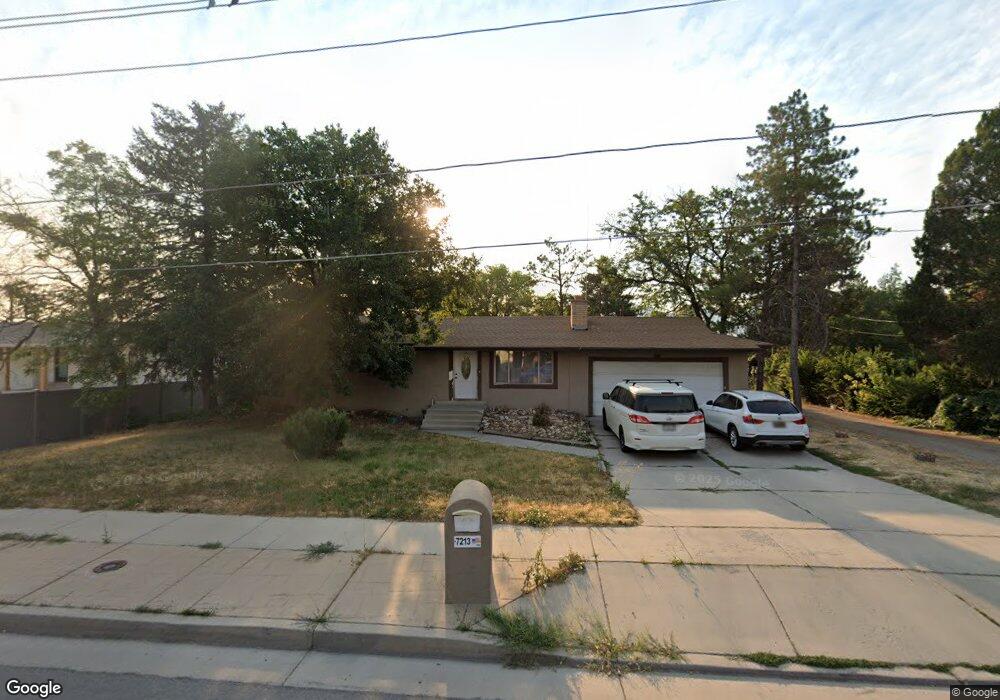
7213 S 3200 W West Jordan, UT 84084
Estimated Value: $502,000 - $539,813
3
Beds
1
Bath
2,260
Sq Ft
$230/Sq Ft
Est. Value
About This Home
This home is located at 7213 S 3200 W, West Jordan, UT 84084 and is currently estimated at $519,203, approximately $229 per square foot. 7213 S 3200 W is a home located in Salt Lake County with nearby schools including Oquirrh Elementary School, West Jordan Middle School, and West Jordan High School.
Ownership History
Date
Name
Owned For
Owner Type
Purchase Details
Closed on
Jan 6, 2023
Sold by
Mendez Roberto
Bought by
Mendez Roberto and Mendez Fabiola Mendez
Current Estimated Value
Purchase Details
Closed on
Dec 22, 2006
Sold by
Williams Harlod L
Bought by
Mendez Roberto
Home Financials for this Owner
Home Financials are based on the most recent Mortgage that was taken out on this home.
Original Mortgage
$184,800
Interest Rate
6.99%
Mortgage Type
New Conventional
Purchase Details
Closed on
Nov 27, 2001
Sold by
Levy Frank R and Levy Willene
Bought by
Williams Harold L
Home Financials for this Owner
Home Financials are based on the most recent Mortgage that was taken out on this home.
Original Mortgage
$141,432
Interest Rate
6.63%
Mortgage Type
FHA
Create a Home Valuation Report for This Property
The Home Valuation Report is an in-depth analysis detailing your home's value as well as a comparison with similar homes in the area
Home Values in the Area
Average Home Value in this Area
Purchase History
| Date | Buyer | Sale Price | Title Company |
|---|---|---|---|
| Mendez Roberto | -- | None Listed On Document | |
| Mendez Roberto | -- | None Listed On Document | |
| Mendez Roberto | -- | None Available | |
| Williams Harold L | -- | Backman Stewart Title Servic |
Source: Public Records
Mortgage History
| Date | Status | Borrower | Loan Amount |
|---|---|---|---|
| Previous Owner | Mendez Roberto | $184,800 | |
| Previous Owner | Williams Harold L | $141,432 | |
| Closed | Williams Harold L | $5,657 |
Source: Public Records
Tax History Compared to Growth
Tax History
| Year | Tax Paid | Tax Assessment Tax Assessment Total Assessment is a certain percentage of the fair market value that is determined by local assessors to be the total taxable value of land and additions on the property. | Land | Improvement |
|---|---|---|---|---|
| 2025 | $2,280 | $469,300 | $185,300 | $284,000 |
| 2024 | $2,280 | $438,600 | $178,100 | $260,500 |
| 2023 | $2,280 | $405,100 | $176,400 | $228,700 |
| 2022 | $2,292 | $408,900 | $172,900 | $236,000 |
| 2021 | $1,843 | $299,300 | $144,100 | $155,200 |
| 2020 | $1,862 | $283,700 | $144,100 | $139,600 |
| 2019 | $1,807 | $270,100 | $121,100 | $149,000 |
| 2018 | $1,661 | $246,200 | $112,800 | $133,400 |
| 2017 | $1,552 | $228,490 | $112,800 | $115,690 |
| 2016 | $1,484 | $205,290 | $125,300 | $79,990 |
| 2015 | $1,590 | $214,390 | $127,600 | $86,790 |
| 2014 | $1,447 | $192,190 | $115,700 | $76,490 |
Source: Public Records
Map
Nearby Homes
- 8524 S Michele River Ave W Unit 109
- 7122 S Wood Green Rd
- 6893 S 3200 W
- 7604 S Autumn Dr
- 2886 W 7550 S
- 3383 W 6880 S
- 7361 S 2700 W
- 7611 S Springbrook Dr
- 6894 S 3420 W
- 6980 S 3535 W Unit 2
- 6968 S 3535 W Unit 3
- 3165 W 7720 S
- 3422 Briar Dr
- 7642 S 2700 W
- 7721 Sunset Cir
- 2573 Jordan Meadows Ln
- 6918 S Harvest Cir
- 3354 W 7800 S
- 2510 W Jordan Meadows Ln
- 6863 S Dixie Dr
- 7229 S 3200 W
- 7179 S 3200 W
- 7216 S 3100 W
- 7245 S 3200 W
- 3212 New World Dr
- 7171 S 3200 W
- 7218 S 3100 W
- 3215 New World Dr
- 3215 W New World Dr
- 3224 W New World Dr
- 7244 S 3100 W
- 3224 New World Dr
- 7254 S 3200 W
- 7167 S 3200 W
- 7265 S 3200 W
- 7264 S 3200 W
- 7215 S 3100 W
- 3231 New World Dr
- 3236 New World Dr
- 7255 Pinta Cir