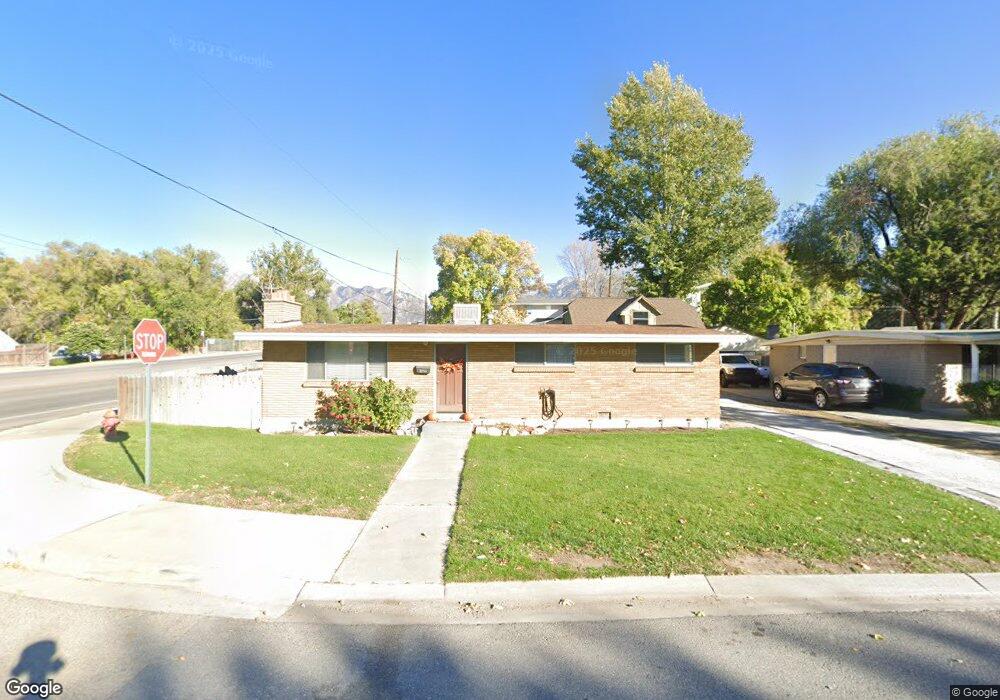
7213 S Pearl Cir Midvale, UT 84047
Estimated Value: $419,000 - $465,203
3
Beds
2
Baths
1,144
Sq Ft
$387/Sq Ft
Est. Value
About This Home
This home is located at 7213 S Pearl Cir, Midvale, UT 84047 and is currently estimated at $442,301, approximately $386 per square foot. 7213 S Pearl Cir is a home located in Salt Lake County with nearby schools including Midvalley Elementary School, Hillcrest High School, and Midvale Middle School.
Ownership History
Date
Name
Owned For
Owner Type
Purchase Details
Closed on
Aug 7, 2020
Sold by
Scribner Ben W
Bought by
7213 Pearl Llc
Current Estimated Value
Purchase Details
Closed on
Oct 8, 2019
Sold by
Nickels Rachel M
Bought by
Scribner Ben W
Purchase Details
Closed on
Sep 30, 2016
Sold by
Nickels Alfred J and Nickels Terasa M
Bought by
Nickels Rachel M
Home Financials for this Owner
Home Financials are based on the most recent Mortgage that was taken out on this home.
Original Mortgage
$150,000
Interest Rate
3.43%
Mortgage Type
New Conventional
Purchase Details
Closed on
Feb 19, 2013
Sold by
Nickels Alfred J
Bought by
Nickels Alfred J and Nickels Teresa M
Purchase Details
Closed on
Nov 6, 2012
Sold by
Beuch Donald R
Bought by
Wong Douglas
Create a Home Valuation Report for This Property
The Home Valuation Report is an in-depth analysis detailing your home's value as well as a comparison with similar homes in the area
Home Values in the Area
Average Home Value in this Area
Purchase History
| Date | Buyer | Sale Price | Title Company |
|---|---|---|---|
| 7213 Pearl Llc | -- | None Available | |
| Scribner Ben W | -- | Inwest Title Srvs Slc | |
| Nickels Rachel M | -- | Meridian Title | |
| Nickels Alfred J | -- | Keystone Title Insurnace Age | |
| Nickels Alfred J | -- | Keystone Title Ins Midvale | |
| Wong Douglas | -- | Unity Title Llc |
Source: Public Records
Mortgage History
| Date | Status | Borrower | Loan Amount |
|---|---|---|---|
| Previous Owner | Nickels Rachel M | $150,000 |
Source: Public Records
Tax History
| Year | Tax Paid | Tax Assessment Tax Assessment Total Assessment is a certain percentage of the fair market value that is determined by local assessors to be the total taxable value of land and additions on the property. | Land | Improvement |
|---|---|---|---|---|
| 2025 | $2,667 | $390,700 | $129,100 | $261,600 |
| 2024 | $2,667 | $373,400 | $121,200 | $252,200 |
| 2023 | $2,538 | $355,300 | $115,200 | $240,100 |
| 2022 | $2,617 | $365,600 | $112,900 | $252,700 |
| 2021 | $2,337 | $276,700 | $112,900 | $163,800 |
| 2020 | $2,195 | $247,000 | $75,400 | $171,600 |
| 2019 | $1,830 | $229,200 | $71,100 | $158,100 |
| 2016 | $1,493 | $176,300 | $71,100 | $105,200 |
Source: Public Records
Map
Nearby Homes
- 7187 S 420 E
- 7240 S 525 E Unit A
- 7240 S 525 E Unit B
- 7230 S 525 E Unit A
- 7230 S 525 E Unit B
- 7230 S 525 E
- 529 E 7215 S Unit 9
- 7218 S Viansa Ct
- 7309 S Union Village Cir
- 7045 S 300 E
- 7033 S 300 E
- 7432 Green Berry Ct
- 7097 S 230 E
- 7083 Village Place
- 221 E Fort Union Blvd
- 6969 S Free Land Ave
- 195 E 7060 S
- 6874 S 595 E Unit 66
- 7214 S 160 E
- 6965 S 700 E
- 7213 Pearl Cir
- 472 7200 S
- 7223 Pearl Cir
- 472 E Fort Union Blvd
- 472 Fort Union Blvd
- 7214 Pearl Cir
- 7214 S Pearl Cir
- 7233 Pearl Cir
- 7230 Pearl Cir
- 432 Fort Union Blvd
- 432 E Fort Union Blvd
- 447 Fort Union Blvd
- 445 Fort Union Blvd
- 465 Fort Union Blvd
- 7241 Pearl Cir
- 500 Fort Union Blvd
- 500 E Fort Union Blvd
- 445 E Fort Union Blvd Unit B
- 445 E Fort Union Blvd Unit A
- 475 Fort Union Blvd
Your Personal Tour Guide
Ask me questions while you tour the home.