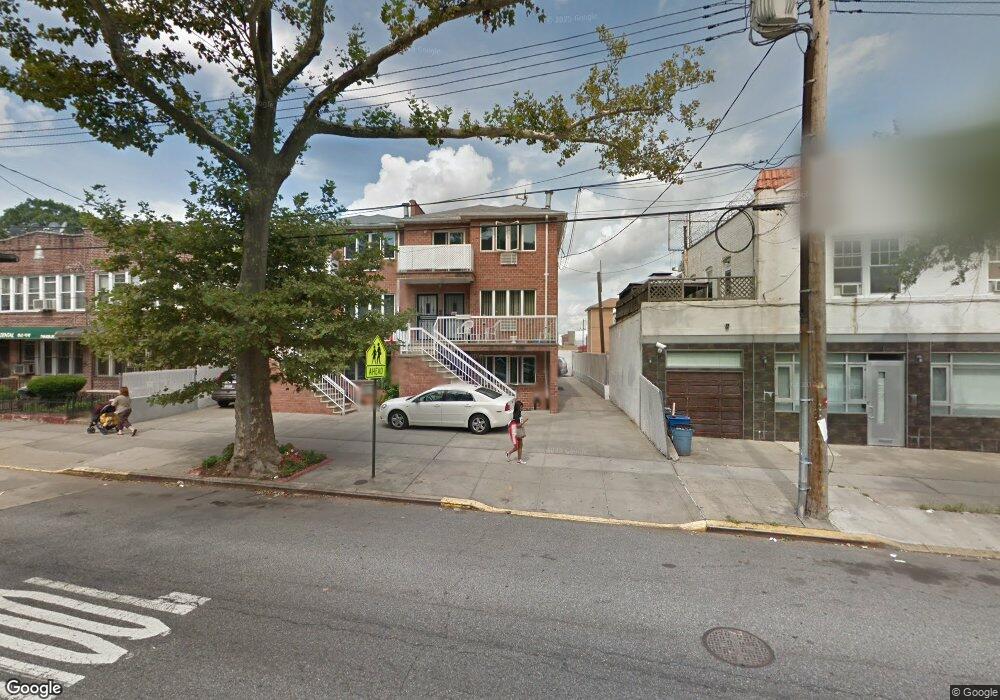
7214 Fort Hamilton Pkwy Unit 3B Brooklyn, NY 11228
Dyker Heights NeighborhoodEstimated Value: $702,000 - $949,000
--
Bed
--
Bath
1,085
Sq Ft
$746/Sq Ft
Est. Value
About This Home
This home is located at 7214 Fort Hamilton Pkwy Unit 3B, Brooklyn, NY 11228 and is currently estimated at $809,085, approximately $745 per square foot. 7214 Fort Hamilton Pkwy Unit 3B is a home located in Kings County with nearby schools including Junior High School 259 William McKinley, Fort Hamilton High School, and St Ephrem School.
Ownership History
Date
Name
Owned For
Owner Type
Purchase Details
Closed on
Aug 25, 2009
Sold by
Montijo Benjamin and Montijo Mary J
Bought by
Huynh Martin and Nguyen Daphuong
Current Estimated Value
Home Financials for this Owner
Home Financials are based on the most recent Mortgage that was taken out on this home.
Original Mortgage
$372,000
Outstanding Balance
$241,554
Interest Rate
5.21%
Mortgage Type
Purchase Money Mortgage
Estimated Equity
$567,531
Purchase Details
Closed on
Apr 11, 2006
Sold by
Bard Ida
Bought by
Montijo Benjamin and Montijo Mary J
Home Financials for this Owner
Home Financials are based on the most recent Mortgage that was taken out on this home.
Original Mortgage
$69,000
Interest Rate
6.4%
Create a Home Valuation Report for This Property
The Home Valuation Report is an in-depth analysis detailing your home's value as well as a comparison with similar homes in the area
Home Values in the Area
Average Home Value in this Area
Purchase History
| Date | Buyer | Sale Price | Title Company |
|---|---|---|---|
| Huynh Martin | $465,000 | -- | |
| Huynh Martin | $465,000 | -- | |
| Montijo Benjamin | $460,000 | -- | |
| Montijo Benjamin | $460,000 | -- |
Source: Public Records
Mortgage History
| Date | Status | Borrower | Loan Amount |
|---|---|---|---|
| Open | Huynh Martin | $372,000 | |
| Closed | Huynh Martin | $372,000 | |
| Previous Owner | Montijo Benjamin | $69,000 | |
| Previous Owner | Montijo Benjamin | $368,000 |
Source: Public Records
Tax History Compared to Growth
Tax History
| Year | Tax Paid | Tax Assessment Tax Assessment Total Assessment is a certain percentage of the fair market value that is determined by local assessors to be the total taxable value of land and additions on the property. | Land | Improvement |
|---|---|---|---|---|
| 2025 | $6,625 | $46,364 | $3,383 | $42,981 |
| 2024 | $6,625 | $41,100 | $3,383 | $37,717 |
| 2023 | $6,304 | $46,515 | $3,383 | $43,132 |
| 2022 | $5,823 | $42,881 | $3,383 | $39,498 |
| 2021 | $5,781 | $38,835 | $3,383 | $35,452 |
| 2020 | $2,873 | $42,001 | $3,383 | $38,618 |
| 2019 | $5,701 | $42,001 | $3,383 | $38,618 |
| 2018 | $5,213 | $27,033 | $2,516 | $24,517 |
| 2017 | $4,899 | $25,504 | $2,562 | $22,942 |
| 2016 | $4,500 | $24,062 | $2,305 | $21,757 |
| 2015 | $1,107 | $24,062 | $2,499 | $21,563 |
| 2014 | $1,107 | $23,879 | $2,451 | $21,428 |
Source: Public Records
Map
Nearby Homes
- 852 71st St
- 949 72nd St
- 914 Bay Ridge Pkwy
- 7109 8th Ave
- 950 70th St Unit 1C
- 7523 Fort Hamilton Pkwy
- 946 Bay Ridge Ave
- 653 Bay Ridge Pkwy
- 954 Bay Ridge Pkwy
- 877 Bay Ridge Ave Unit 3H
- 652 73rd St
- 847 Bay Ridge Ave
- 845 Bay Ridge Ave
- 655 76th St
- 639 74th St
- 850 68th St
- 6801 Fort Hamilton Pkwy
- 843 68th St
- 949 78th St
- 1001 Bay Ridge Ave
- 7214 Fort Hamilton Pkwy Unit 2B
- 7214 Fort Hamilton Pkwy Unit 1B
- 7216 Fort Hamilton Pkwy Unit 3A
- 7216 Fort Hamilton Pkwy Unit 2A
- 7216 Fort Hamilton Pkwy Unit 1A
- 7216 Fort Hamilton Pkwy
- 7218 Fort Hamilton Pkwy
- 7222 Fort Hamilton Pkwy
- 880 72nd St
- 876 72nd St
- 878 72nd St
- 882 72nd St
- 874 72nd St
- 869 73rd St
- 7224 Fort Hamilton Pkwy
- 7200-7212 Fort Hamilton Pkwy
- 7202 Fort Hamilton Pkwy Unit 2
- 7202 Fort Hamilton Pkwy
- 870 72nd St
- 866 72nd St