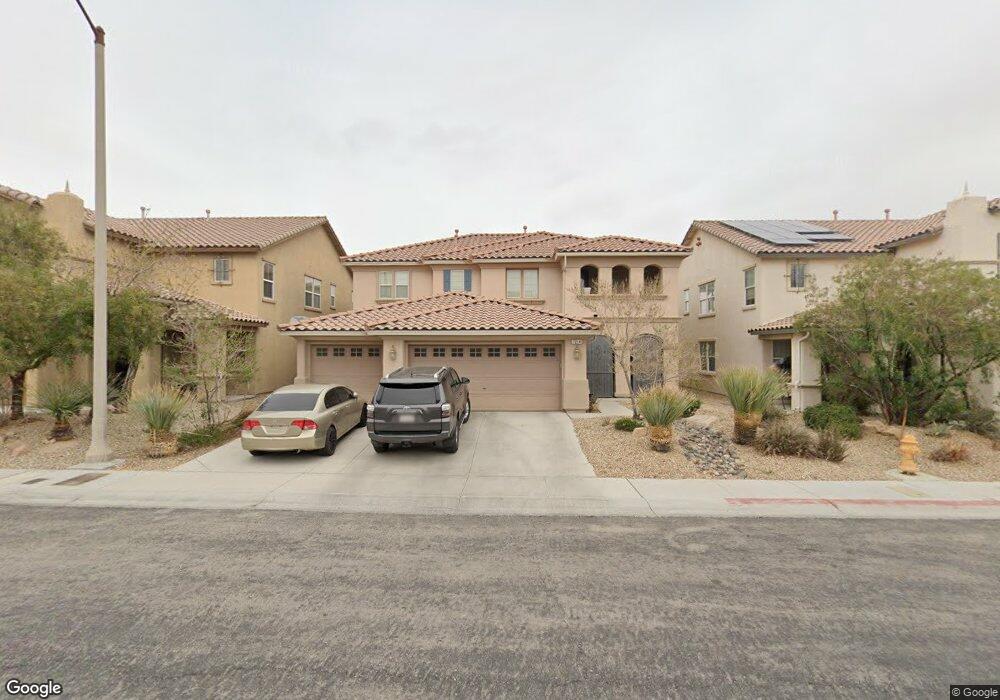
7214 Mountain Den Ave Unit 2 Las Vegas, NV 89179
Mountains Edge NeighborhoodEstimated Value: $643,501 - $747,000
5
Beds
4
Baths
3,081
Sq Ft
$219/Sq Ft
Est. Value
About This Home
This home is located at 7214 Mountain Den Ave Unit 2, Las Vegas, NV 89179 and is currently estimated at $675,875, approximately $219 per square foot. 7214 Mountain Den Ave Unit 2 is a home located in Clark County with nearby schools including Desert Oasis High School and Doral Academy Cactus.
Ownership History
Date
Name
Owned For
Owner Type
Purchase Details
Closed on
Jun 6, 2011
Sold by
Golbourne Leithland Q and Golbourne Constance B
Bought by
Pagsisihan Arvin C and Pagsisihan Ji W
Current Estimated Value
Home Financials for this Owner
Home Financials are based on the most recent Mortgage that was taken out on this home.
Original Mortgage
$177,255
Outstanding Balance
$123,563
Interest Rate
4.87%
Mortgage Type
FHA
Estimated Equity
$552,312
Purchase Details
Closed on
Mar 11, 2008
Sold by
Golbourne Leithland and Golbourne Constance
Bought by
Golbourne Leithland Q and Golbourne Constance B
Purchase Details
Closed on
Dec 7, 2006
Sold by
Kb Home Nevada Inc
Bought by
Golbourne Leithland and Golbourne Constance
Home Financials for this Owner
Home Financials are based on the most recent Mortgage that was taken out on this home.
Original Mortgage
$335,992
Interest Rate
5%
Mortgage Type
Negative Amortization
Create a Home Valuation Report for This Property
The Home Valuation Report is an in-depth analysis detailing your home's value as well as a comparison with similar homes in the area
Home Values in the Area
Average Home Value in this Area
Purchase History
| Date | Buyer | Sale Price | Title Company |
|---|---|---|---|
| Pagsisihan Arvin C | $195,000 | Old Republic Title Company | |
| Golbourne Leithland Q | -- | None Available | |
| Golbourne Leithland | $419,990 | First Amer Title Co Of Nv |
Source: Public Records
Mortgage History
| Date | Status | Borrower | Loan Amount |
|---|---|---|---|
| Open | Pagsisihan Arvin C | $177,255 | |
| Previous Owner | Golbourne Leithland | $335,992 |
Source: Public Records
Tax History Compared to Growth
Tax History
| Year | Tax Paid | Tax Assessment Tax Assessment Total Assessment is a certain percentage of the fair market value that is determined by local assessors to be the total taxable value of land and additions on the property. | Land | Improvement |
|---|---|---|---|---|
| 2025 | $2,994 | $200,202 | $45,500 | $154,702 |
| 2024 | $2,907 | $200,202 | $45,500 | $154,702 |
| 2023 | $2,907 | $194,669 | $49,000 | $145,669 |
| 2022 | $3,095 | $167,242 | $35,000 | $132,242 |
| 2021 | $2,866 | $144,499 | $35,000 | $109,499 |
| 2020 | $2,658 | $137,829 | $33,250 | $104,579 |
| 2019 | $2,491 | $132,572 | $29,750 | $102,822 |
| 2018 | $2,377 | $116,087 | $25,900 | $90,187 |
| 2017 | $3,282 | $111,915 | $25,550 | $86,365 |
| 2016 | $2,225 | $100,545 | $17,500 | $83,045 |
| 2015 | $2,221 | $91,751 | $15,750 | $76,001 |
| 2014 | $2,156 | $71,311 | $9,450 | $61,861 |
Source: Public Records
Map
Nearby Homes
- 7134 Mountain Den Ave
- 7125 Mountain Den Ave
- 7182 Hood River Ave
- 7115 Hickory Post Ave
- 7057 Fort Union Ct
- 7055 Fort Tule Ave
- 7286 Caballo Range Ave
- 7063 Bering Strait Ave
- 6994 Geronimo Springs Ave
- 11083 Camden Bay St
- 7397 Cobbhan Dr
- 7012 Grand Junction Ave
- 11173 Hickory Glen St
- 7125 Neches Ave
- 10925 Prudhoe Bay St
- 7104 Flathead River Ave
- 10993 Dunoon St
- 7414 Morisset Ave
- 0 W Erie Ave
- 11068 Hunting Hawk Rd
- 7204 Mountain Den Ave Unit Room 2
- 7204 Mountain Den Ave
- 7204 Mountain Den Ave Unit Room 2
- 7204 Mountain Den Ave Unit Room 1
- 7204 Mountain Den Ave Unit Room 4
- 7204 Mountain Den Ave
- 7224 Mountain Den Ave
- 7194 Mountain Den Ave
- 7234 Mountain Den Ave
- 7217 Los Banderos Ave
- 7227 Los Banderos Ave
- 7207 Los Banderos Ave
- 7197 Los Banderos Ave
- 7237 Los Banderos Ave Unit 2A
- 7184 Mountain Den Ave Unit none
- 7184 Mountain Den Ave
- 7215 Mountain Den Ave
- 7215 Mountain Den Ave Unit n/a
- 7205 Mountain Den Ave
- 7225 Mountain Den Ave