Estimated Value: $735,000 - $899,000
3
Beds
2
Baths
3,328
Sq Ft
$251/Sq Ft
Est. Value
About This Home
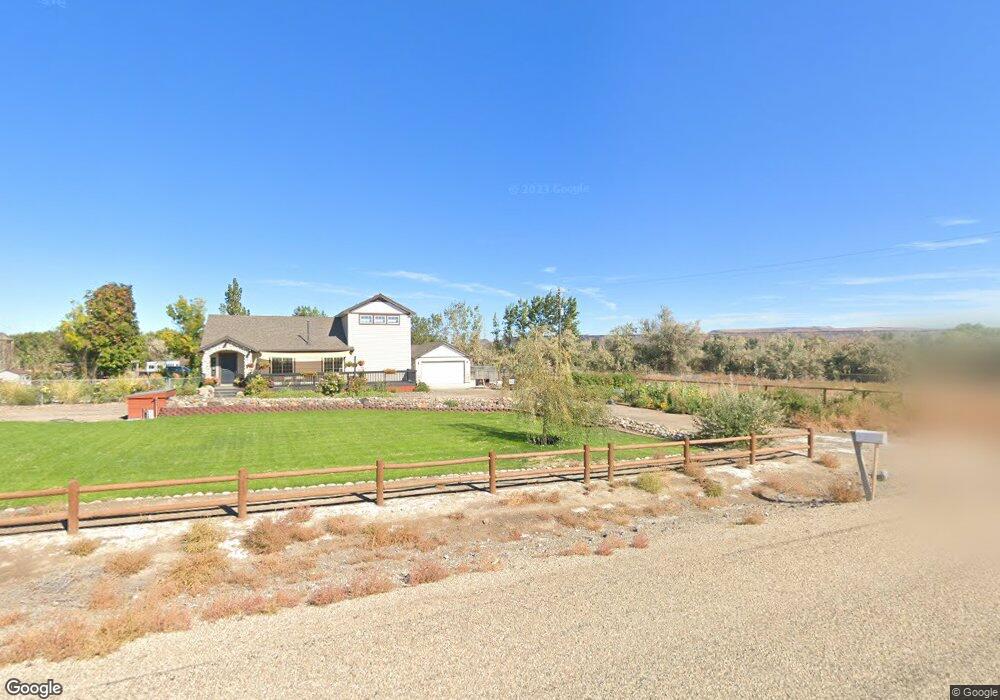
This home is located at 7214 Opaline Rd, Melba, ID 83641 and is currently estimated at $836,291, approximately $251 per square foot. 7214 Opaline Rd is a home with nearby schools including Marsing Elementary School, Marsing Middle School, and Marsing High School.
Ownership History
Date
Name
Owned For
Owner Type
Purchase Details
Closed on
Oct 21, 2022
Sold by
Unknown
Bought by
Metcalf Jeff
Current Estimated Value
Home Financials for this Owner
Home Financials are based on the most recent Mortgage that was taken out on this home.
Original Mortgage
$200,000
Interest Rate
6.58%
Mortgage Type
New Conventional
Purchase Details
Closed on
Apr 18, 2016
Sold by
Metcalf Jeff and Metcalf Jeffrey M
Bought by
Metcalf Jeff
Home Financials for this Owner
Home Financials are based on the most recent Mortgage that was taken out on this home.
Original Mortgage
$155,500
Interest Rate
3.68%
Mortgage Type
New Conventional
Purchase Details
Closed on
Sep 21, 2006
Sold by
Metcalf Jeff
Bought by
Metcalf Jeffrey M
Home Financials for this Owner
Home Financials are based on the most recent Mortgage that was taken out on this home.
Original Mortgage
$192,516
Interest Rate
6.53%
Mortgage Type
FHA
Create a Home Valuation Report for This Property
The Home Valuation Report is an in-depth analysis detailing your home's value as well as a comparison with similar homes in the area
Purchase History
| Date | Buyer | Sale Price | Title Company |
|---|---|---|---|
| Metcalf Jeff | -- | Alliance Title | |
| Metcalf Jeff | -- | Pioneer Title Cayon Caldwel | |
| Metcalf Jeffrey M | -- | -- |
Source: Public Records
Mortgage History
| Date | Status | Borrower | Loan Amount |
|---|---|---|---|
| Previous Owner | Metcalf Jeff | $200,000 | |
| Previous Owner | Metcalf Jeff | $155,500 | |
| Previous Owner | Metcalf Jeffrey M | $192,516 |
Source: Public Records
Tax History
| Year | Tax Paid | Tax Assessment Tax Assessment Total Assessment is a certain percentage of the fair market value that is determined by local assessors to be the total taxable value of land and additions on the property. | Land | Improvement |
|---|---|---|---|---|
| 2025 | -- | $699,043 | $135,403 | $563,640 |
| 2024 | -- | $709,953 | $135,403 | $574,550 |
| 2023 | -- | $711,163 | $135,403 | $575,760 |
| 2022 | $4,556 | $727,513 | $135,403 | $592,110 |
| 2021 | $4,102 | $504,139 | $109,849 | $394,290 |
| 2020 | $3,515 | $418,616 | $79,340 | $339,276 |
| 2019 | $3,860 | $380,768 | $79,340 | $301,428 |
| 2018 | $3,863 | $354,429 | $66,117 | $288,312 |
| 2017 | $3,732 | $354,861 | $66,117 | $288,744 |
| 2016 | $3,260 | $329,120 | $56,000 | $273,120 |
| 2014 | $1,778 | $249,448 | $40,288 | $209,160 |
| 2011 | -- | $203,451 | $30,003 | $173,448 |
Source: Public Records
Map
Nearby Homes
- TBD Island View Dr - Lot 2
- TBD Island View Dr - Lot 1
- TBD Blue Fox Ln
- 8004 Birmingham Rd
- 9494 Sleepy Hollow Dr
- 0 Sage View Ln Parcel 2
- 0 Sage View Ln Parcel 4
- 8065 Moonshine Ln
- 10142 Airpark Loop Rd
- 11487 Idaho 78
- 13294 N Fork Ln
- TBD Mountain Hawk Rd
- 000 Farner Rd
- 9002 Deer Flat
- 8142 Us Highway 95
- TBD Oak River Ln
- 1406 Oak River Ln
- 11326 W Rio Rd
- 14370 Fractus Dr
- 9770 Farner Rd
- 7248 Opaline Rd
- 7158 Opaline Rd
- 7259 Opaline Rd
- 7300 Opaline Rd
- 7111 Opaline Rd
- 7111 Opaline Rd
- 8890 Clark Rd
- 7343 Opaline Rd
- 7056 Opaline Rd
- 7421 Opaline Rd
- 7339 Meininger Rd
- 7042 Opaline Rd
- 8712 Clark Rd
- tbd Lot 1 Geiger Sub Across From Opaline Rd Inter
- TBD Opaline Rd
- 8962 Clark Rd
- 7024 Opaline Rd
- 8962 Clark Rd
- 7417 Opaline Rd
- 7377 Meininger Rd