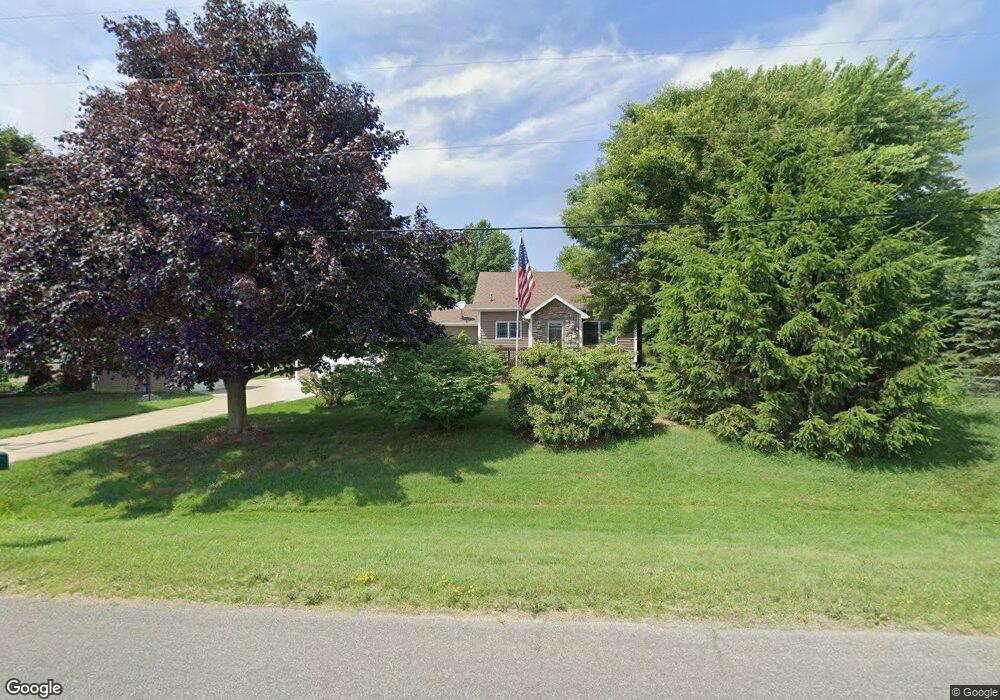
72142 16th Ave South Haven, MI 49090
Estimated Value: $477,000 - $539,000
2
Beds
3
Baths
2,856
Sq Ft
$179/Sq Ft
Est. Value
About This Home
This home is located at 72142 16th Ave, South Haven, MI 49090 and is currently estimated at $510,311, approximately $178 per square foot. 72142 16th Ave is a home located in Van Buren County with nearby schools including South Haven High School, St. Paul Lutheran School, and St. Basil School.
Ownership History
Date
Name
Owned For
Owner Type
Purchase Details
Closed on
Oct 27, 2016
Sold by
Rumler Tammy and Rumler Ryan
Bought by
Rumler Tammy and Rumler Ryan
Current Estimated Value
Home Financials for this Owner
Home Financials are based on the most recent Mortgage that was taken out on this home.
Original Mortgage
$185,200
Interest Rate
3.48%
Mortgage Type
New Conventional
Purchase Details
Closed on
Jun 6, 2006
Sold by
Jones Tammy L
Bought by
Jones Tammy L and Rumler Ryan
Home Financials for this Owner
Home Financials are based on the most recent Mortgage that was taken out on this home.
Original Mortgage
$215,000
Interest Rate
6.66%
Mortgage Type
Stand Alone Refi Refinance Of Original Loan
Purchase Details
Closed on
Dec 2, 2004
Sold by
Jones Steven W and Rose Tammy L
Bought by
Jones Tammy L
Home Financials for this Owner
Home Financials are based on the most recent Mortgage that was taken out on this home.
Original Mortgage
$88,000
Interest Rate
5.71%
Mortgage Type
Stand Alone Refi Refinance Of Original Loan
Create a Home Valuation Report for This Property
The Home Valuation Report is an in-depth analysis detailing your home's value as well as a comparison with similar homes in the area
Home Values in the Area
Average Home Value in this Area
Purchase History
| Date | Buyer | Sale Price | Title Company |
|---|---|---|---|
| Rumler Tammy | -- | Chicago Title Of Michigan | |
| Jones Tammy L | -- | Chicago Title Insurance | |
| Jones Tammy L | -- | Chicago Title |
Source: Public Records
Mortgage History
| Date | Status | Borrower | Loan Amount |
|---|---|---|---|
| Closed | Rumler Tammy | $185,200 | |
| Closed | Jones Tammy L | $215,000 | |
| Closed | Jones Tammy L | $88,000 |
Source: Public Records
Tax History Compared to Growth
Tax History
| Year | Tax Paid | Tax Assessment Tax Assessment Total Assessment is a certain percentage of the fair market value that is determined by local assessors to be the total taxable value of land and additions on the property. | Land | Improvement |
|---|---|---|---|---|
| 2025 | $2,665 | $241,000 | $0 | $0 |
| 2024 | $1,304 | $240,300 | $0 | $0 |
| 2023 | $1,242 | $208,300 | $0 | $0 |
| 2022 | $2,405 | $179,100 | $0 | $0 |
| 2021 | $2,278 | $146,500 | $15,200 | $131,300 |
| 2020 | $2,251 | $142,300 | $15,200 | $127,100 |
| 2019 | $2,136 | $140,700 | $140,700 | $0 |
| 2018 | $2,723 | $110,400 | $110,400 | $0 |
| 2017 | $2,554 | $86,000 | $0 | $0 |
| 2016 | $2,528 | $85,900 | $0 | $0 |
| 2015 | $1,780 | $85,900 | $0 | $0 |
| 2014 | $1,898 | $60,300 | $0 | $0 |
| 2013 | -- | $58,400 | $58,400 | $0 |
Source: Public Records
Map
Nearby Homes
- 13670 73rd St
- 69636 County Road 384
- 70386 M 43 Unit Lot C
- 13537 M 140
- 10505 Compton Dr Unit 1
- 15010 Highway M-140
- 72597 Faye Ct
- 13241 Deercreek Ct
- 19400 Michigan 140
- 00 V L M-140 Hwy
- 14606 Crest View Ct
- 68687 Michigan 43
- 0 14th Ave Unit 25012379
- 21783 Michigan 140
- 21679 Michigan 140
- 74213 10th Ave
- 16280 76th St
- 09279 M-140 Hwy
- 76831 Wood Crest Ct
- 76757 Wood Crest Ct