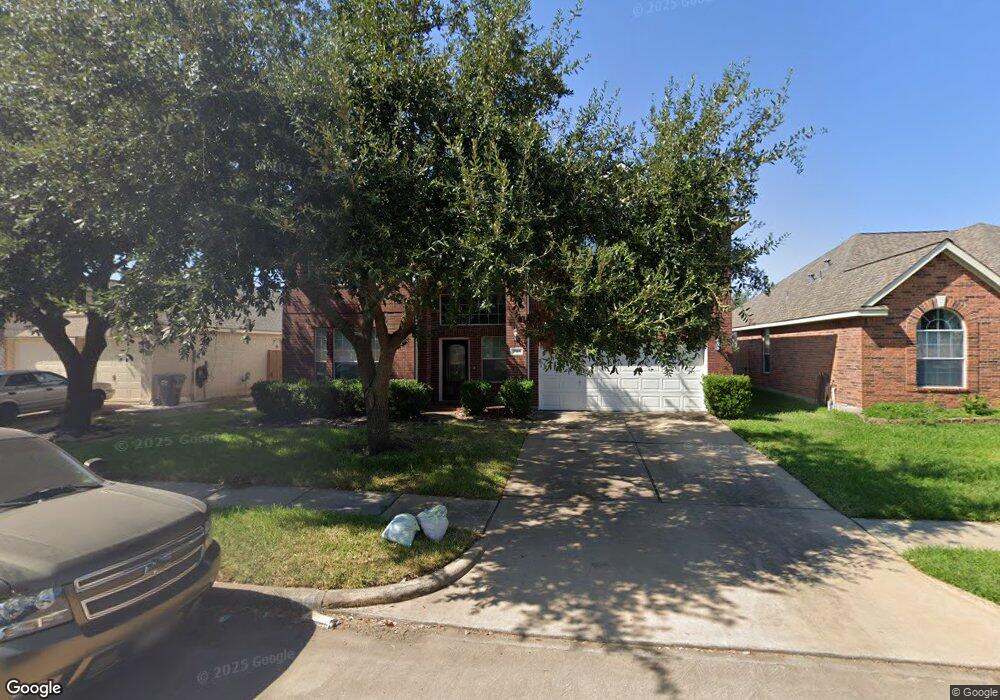
7215 April Creek Ln Houston, TX 77095
Copperfield NeighborhoodEstimated Value: $328,916 - $342,000
4
Beds
3
Baths
2,588
Sq Ft
$130/Sq Ft
Est. Value
About This Home
This home is located at 7215 April Creek Ln, Houston, TX 77095 and is currently estimated at $335,229, approximately $129 per square foot. 7215 April Creek Ln is a home located in Harris County with nearby schools including Holmsley Elementary School, Aragon Middle School, and Langham Creek High School.
Ownership History
Date
Name
Owned For
Owner Type
Purchase Details
Closed on
Oct 8, 2013
Sold by
Kane Percival I and Kane Rachel A
Bought by
Kane Preson Ivan and Kane Percival I
Current Estimated Value
Home Financials for this Owner
Home Financials are based on the most recent Mortgage that was taken out on this home.
Original Mortgage
$146,163
Outstanding Balance
$108,942
Interest Rate
4.37%
Mortgage Type
FHA
Estimated Equity
$226,287
Purchase Details
Closed on
Nov 28, 2005
Sold by
Lennar Homes Of Texas Land & Const Ltd
Bought by
Lennar Homes Of Texas Sales & Mktg Ltd and Lennar Homes Of Texas
Home Financials for this Owner
Home Financials are based on the most recent Mortgage that was taken out on this home.
Original Mortgage
$136,500
Interest Rate
6.06%
Mortgage Type
Stand Alone First
Create a Home Valuation Report for This Property
The Home Valuation Report is an in-depth analysis detailing your home's value as well as a comparison with similar homes in the area
Home Values in the Area
Average Home Value in this Area
Purchase History
| Date | Buyer | Sale Price | Title Company |
|---|---|---|---|
| Kane Preson Ivan | -- | None Available | |
| Lennar Homes Of Texas Sales & Mktg Ltd | -- | North American Title Company | |
| Kane Percival I | -- | North American Title Company |
Source: Public Records
Mortgage History
| Date | Status | Borrower | Loan Amount |
|---|---|---|---|
| Open | Kane Preson Ivan | $146,163 | |
| Previous Owner | Kane Percival I | $136,500 | |
| Previous Owner | Lennar Homes Of Texas Sales & Mktg Ltd | $34,100 |
Source: Public Records
Tax History Compared to Growth
Tax History
| Year | Tax Paid | Tax Assessment Tax Assessment Total Assessment is a certain percentage of the fair market value that is determined by local assessors to be the total taxable value of land and additions on the property. | Land | Improvement |
|---|---|---|---|---|
| 2025 | $7,799 | $326,331 | $58,568 | $267,763 |
| 2024 | $7,799 | $319,928 | $58,568 | $261,360 |
| 2023 | $7,799 | $341,146 | $58,568 | $282,578 |
| 2022 | $7,778 | $300,552 | $41,738 | $258,814 |
| 2021 | $6,561 | $242,452 | $41,738 | $200,714 |
| 2020 | $6,436 | $231,559 | $31,977 | $199,582 |
| 2019 | $6,334 | $221,036 | $24,572 | $196,464 |
| 2018 | $2,953 | $205,048 | $24,572 | $180,476 |
| 2017 | $5,877 | $205,048 | $24,572 | $180,476 |
| 2016 | $5,593 | $195,116 | $24,572 | $170,544 |
| 2015 | $5,228 | $195,116 | $24,572 | $170,544 |
| 2014 | $5,228 | $179,798 | $24,572 | $155,226 |
Source: Public Records
Map
Nearby Homes
- 17230 Valhallah Way
- 17234 Rush Trace Ct
- 17206 Haley Falls Ln
- 16902 Terrace Park Dr
- 17114 Sheffield Pines Ln
- 17222 Crown Meadow Ct
- 17003 Summer Dew Ln
- 17015 Sky Blue Place
- 17326 Masonridge Dr
- 7306 Bubbling Brooks Ln
- 17325 Fm 529 Rd
- 7311 Barton Oaks Dr
- 17523 Hamilwood Dr
- 17527 Hamilwood Dr
- 17531 Hamilwood Dr
- 17250 Cricketbriar Ct
- 7254 Sonnet Glen Ln
- 17522 Masonridge Dr
- 17214 Palm Falls Ct
- 17602 Wild Willow Ln
- 7219 7219 April Creek Ln
- 7211 April Creek Ln
- 7219 April Creek Ln
- 7207 April Creek Ln
- 7223 April Creek Ln
- 7226 Broadelm Dr
- 7222 Broadelm Dr
- 7230 Broadelm Dr
- 7218 Broadelm Dr
- 17222 Verdant Willow Way
- 7234 Broadelm Dr
- 7214 April Creek Ln
- 7203 April Creek Ln
- 7218 April Creek Ln
- 7214 Broadelm Dr
- 7302 Broadelm Dr
- 7222 April Creek Ln
- 7307 April Creek Ln
- 17218 Verdant Willow Way
- 17227 Verdant Willow Way