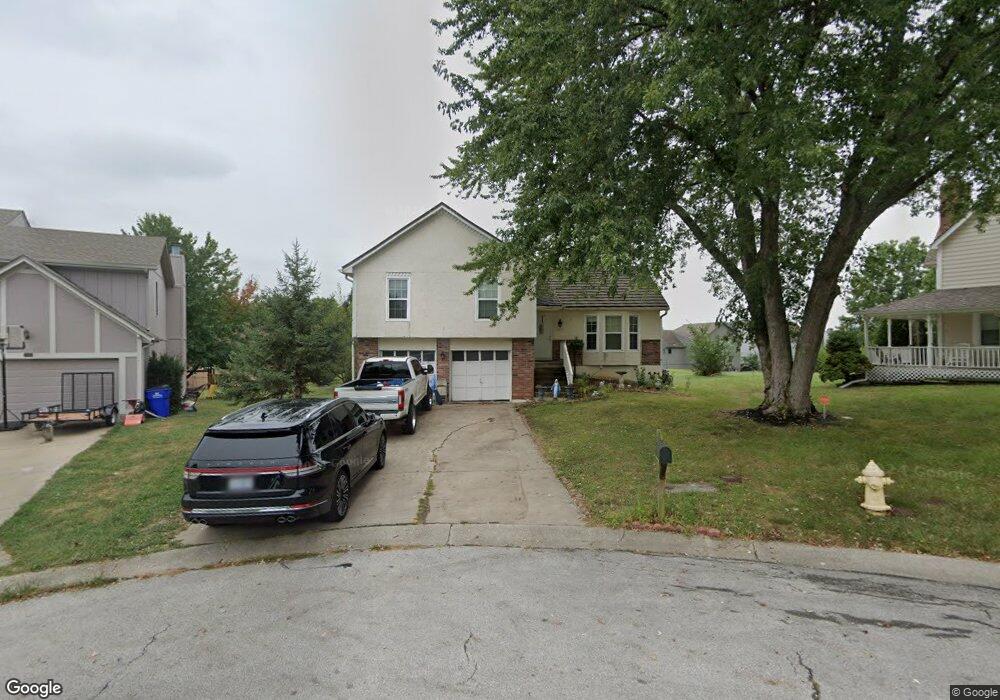
7217 E 134th Cir Grandview, MO 64030
Estimated Value: $249,000 - $296,000
3
Beds
2
Baths
1,507
Sq Ft
$184/Sq Ft
Est. Value
About This Home
This home is located at 7217 E 134th Cir, Grandview, MO 64030 and is currently estimated at $276,679, approximately $183 per square foot. 7217 E 134th Cir is a home located in Jackson County with nearby schools including Meadowmere Elementary School, Grandview Middle, and Grandview High School.
Ownership History
Date
Name
Owned For
Owner Type
Purchase Details
Closed on
Jun 26, 2002
Sold by
Bank One National Assn
Bought by
Rocha Sergio and Medina Estela
Current Estimated Value
Home Financials for this Owner
Home Financials are based on the most recent Mortgage that was taken out on this home.
Original Mortgage
$91,200
Outstanding Balance
$41,108
Interest Rate
7.75%
Mortgage Type
Purchase Money Mortgage
Estimated Equity
$235,571
Purchase Details
Closed on
Dec 20, 2001
Sold by
White Ronda R and White William E
Bought by
S Pooling and Servicing S
Purchase Details
Closed on
Jul 28, 1998
Sold by
Burton Lou L and Burton Terre L
Bought by
White William E and White Ronda R
Home Financials for this Owner
Home Financials are based on the most recent Mortgage that was taken out on this home.
Original Mortgage
$106,200
Interest Rate
12.75%
Mortgage Type
Purchase Money Mortgage
Create a Home Valuation Report for This Property
The Home Valuation Report is an in-depth analysis detailing your home's value as well as a comparison with similar homes in the area
Home Values in the Area
Average Home Value in this Area
Purchase History
| Date | Buyer | Sale Price | Title Company |
|---|---|---|---|
| Rocha Sergio | -- | First American Title Ins Co | |
| S Pooling | $113,815 | First American Title Ins | |
| White William E | -- | -- |
Source: Public Records
Mortgage History
| Date | Status | Borrower | Loan Amount |
|---|---|---|---|
| Open | Rocha Sergio | $91,200 | |
| Previous Owner | White William E | $106,200 |
Source: Public Records
Tax History
| Year | Tax Paid | Tax Assessment Tax Assessment Total Assessment is a certain percentage of the fair market value that is determined by local assessors to be the total taxable value of land and additions on the property. | Land | Improvement |
|---|---|---|---|---|
| 2025 | $3,525 | $46,813 | $7,190 | $39,623 |
| 2024 | $3,464 | $43,343 | $4,761 | $38,582 |
| 2023 | $3,464 | $43,343 | $5,784 | $37,559 |
| 2022 | $3,083 | $35,910 | $4,769 | $31,141 |
| 2021 | $3,080 | $35,910 | $4,769 | $31,141 |
| 2020 | $2,646 | $32,677 | $4,769 | $27,908 |
| 2019 | $2,552 | $32,677 | $4,769 | $27,908 |
| 2018 | $1,922 | $22,894 | $2,586 | $20,308 |
| 2017 | $1,922 | $22,894 | $2,586 | $20,308 |
| 2016 | $1,847 | $21,550 | $2,885 | $18,665 |
Source: Public Records
Map
Nearby Homes
- 7403 E 134th Terrace
- 13408 Bristol Ave
- 13429 Winchester Ave
- 13213 Winchester Ave
- 6712 E 134th St
- 13218 Craig Ave
- 13616 Winchester Ave
- 13250 Park Hills Dr
- 7601 High Grove Rd
- 13420 Belmeade Ave
- 13413 Lowell Ave
- 13008 Crystal Ave
- 6404 E 133rd Terrace
- 7905 High Grove Rd
- 8209 E 133rd Terrace
- 13012 Bristol Ave
- 7505 E 130th St
- 7820 E 130th Ct
- 13321 Applewood Dr
- 13801 Lowell Ave
- 7219 E 134th Cir
- 7215 E 134th Cir
- 7213 E 134th Cir
- 7221 E 134th Cir
- 7200 E 134th Terrace
- 7209 E 134th Cir
- 7211 E 134th Cir
- 7202 E 134th Terrace
- 7108 E 134th Terrace
- 7207 E 134th Cir
- 7204 E 134th Terrace
- 7223 E 134th Cir
- 7106 E 134th Terrace
- 7205 E 134th Cir
- 13313 Crystal Ave
- 13315 Crystal Ave
- 7104 E 134th Terrace
- 7225 E 134th Cir
- 7201 E 134th Terrace
- 7203 E 134th Cir
Your Personal Tour Guide
Ask me questions while you tour the home.