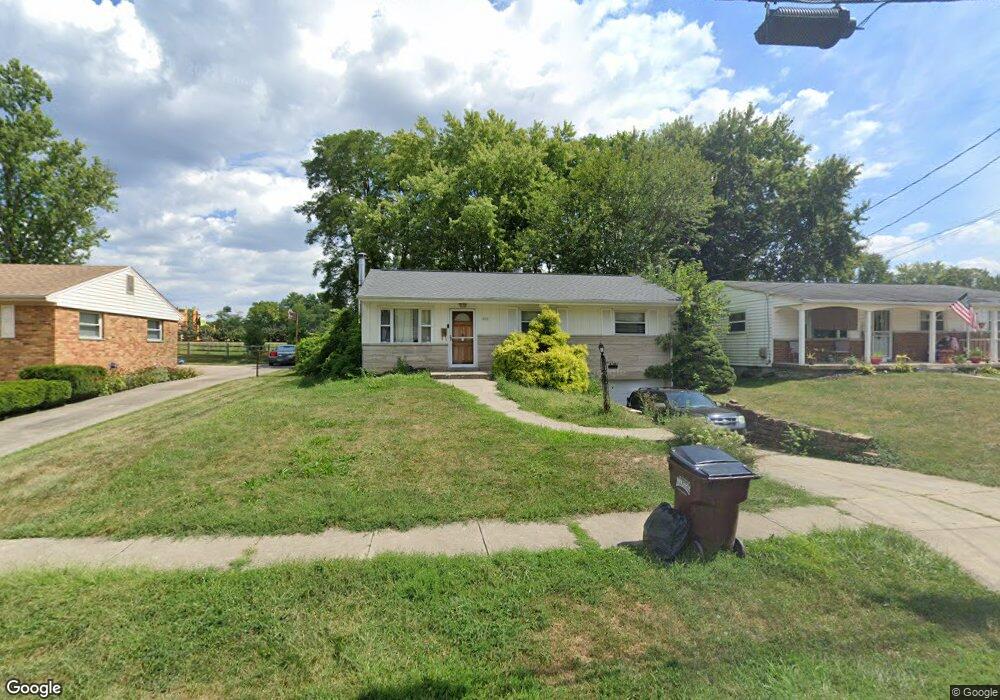
7218 Jamerine Ct Cincinnati, OH 45239
Estimated Value: $175,752 - $225,000
3
Beds
2
Baths
1,026
Sq Ft
$193/Sq Ft
Est. Value
About This Home
This home is located at 7218 Jamerine Ct, Cincinnati, OH 45239 and is currently estimated at $198,188, approximately $193 per square foot. 7218 Jamerine Ct is a home located in Hamilton County with nearby schools including White Oak Middle School, Colerain High School, and Cincinnati Achievement Academy.
Ownership History
Date
Name
Owned For
Owner Type
Purchase Details
Closed on
Sep 29, 2006
Sold by
Equity Sales Professionals Llc
Bought by
Walker Alvin L
Current Estimated Value
Home Financials for this Owner
Home Financials are based on the most recent Mortgage that was taken out on this home.
Original Mortgage
$101,600
Outstanding Balance
$64,513
Interest Rate
7.65%
Mortgage Type
Stand Alone First
Estimated Equity
$133,675
Purchase Details
Closed on
May 31, 2006
Sold by
Eiler Scot D
Bought by
Equity Sales Professionals Llc
Home Financials for this Owner
Home Financials are based on the most recent Mortgage that was taken out on this home.
Original Mortgage
$80,550
Interest Rate
6.68%
Mortgage Type
Unknown
Purchase Details
Closed on
Aug 30, 2002
Sold by
Weis Darlene Sue and Eiler Darlene Sue
Bought by
Eiler Scot D
Home Financials for this Owner
Home Financials are based on the most recent Mortgage that was taken out on this home.
Original Mortgage
$88,000
Interest Rate
8.37%
Create a Home Valuation Report for This Property
The Home Valuation Report is an in-depth analysis detailing your home's value as well as a comparison with similar homes in the area
Home Values in the Area
Average Home Value in this Area
Purchase History
| Date | Buyer | Sale Price | Title Company |
|---|---|---|---|
| Walker Alvin L | $127,000 | Attorney | |
| Equity Sales Professionals Llc | $68,000 | None Available | |
| Eiler Scot D | -- | Premier Title Services Inc |
Source: Public Records
Mortgage History
| Date | Status | Borrower | Loan Amount |
|---|---|---|---|
| Open | Walker Alvin L | $101,600 | |
| Previous Owner | Equity Sales Professionals Llc | $80,550 | |
| Previous Owner | Eiler Scot D | $88,000 |
Source: Public Records
Tax History Compared to Growth
Tax History
| Year | Tax Paid | Tax Assessment Tax Assessment Total Assessment is a certain percentage of the fair market value that is determined by local assessors to be the total taxable value of land and additions on the property. | Land | Improvement |
|---|---|---|---|---|
| 2024 | $1,933 | $36,051 | $8,026 | $28,025 |
| 2023 | $1,945 | $36,051 | $8,026 | $28,025 |
| 2022 | $1,478 | $22,285 | $6,279 | $16,006 |
| 2021 | $1,465 | $22,285 | $6,279 | $16,006 |
| 2020 | $1,480 | $22,285 | $6,279 | $16,006 |
| 2019 | $1,344 | $18,883 | $5,320 | $13,563 |
| 2018 | $1,207 | $18,883 | $5,320 | $13,563 |
| 2017 | $1,144 | $18,883 | $5,320 | $13,563 |
| 2016 | $1,268 | $20,692 | $7,308 | $13,384 |
| 2015 | $1,280 | $20,692 | $7,308 | $13,384 |
| 2014 | $1,283 | $20,692 | $7,308 | $13,384 |
| 2013 | $1,327 | $22,495 | $7,945 | $14,550 |
Source: Public Records
Map
Nearby Homes
- 6851 Rutherford Ct
- 3041 Preserve Ln
- 2481 Crosley Meadow
- 7476 Boleyn Dr
- 3171 Preserve Ln
- 3250 March Terrace
- 8245 Royal Heights Dr
- 2390 Golf Dr
- 3232 Lapland Dr
- 8278 Lyness Dr
- 2729 Hennge Dr
- 2412 Amelia Ct
- 8281 Royal Heights Dr
- 2347 Golf Dr
- 2598 Byrneside Dr
- 3329 Alexis Rd
- 3310 March Terrace
- 2538 Byrneside Dr
- 2424 Banning Rd
- 8335 Jackies Dr
- 7210 Jamerine Ct
- 7226 Jamerine Ct
- 7234 Jamerine Ct
- 2824 Jonrose Ave
- 2832 Jonrose Ave
- 7223 Jamerine Ct
- 2816 Jonrose Ave
- 7213 Jamerine Ct
- 7231 Jamerine Ct
- 7242 Jamerine Ct
- 2844 Jonrose Ave
- 2808 Jonrose Ave
- 7239 Jamerine Ct
- 2856 Jonrose Ave
- 7253 Jamerine Ct
- 2796 Jonrose Ave
- 2862 Jonrose Ave
- 2825 Jonrose Ave
- 7258 Jamerine Ct
- 2819 Jonrose Ave