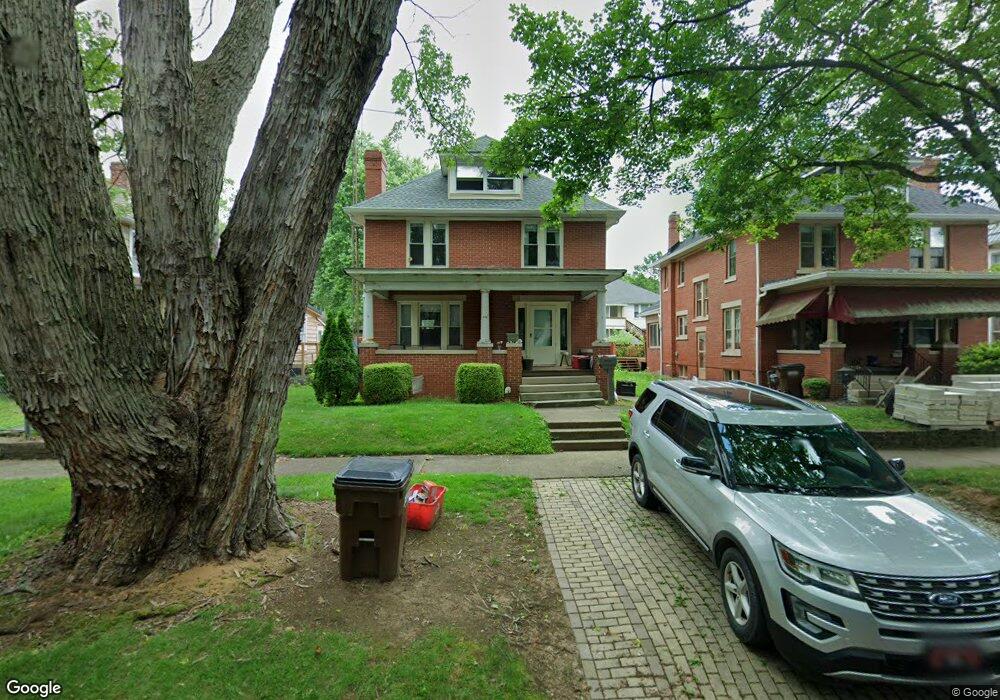
722 1/2 N 7th St Marietta, OH 45750
Estimated Value: $170,000 - $222,000
5
Beds
2
Baths
1,782
Sq Ft
$112/Sq Ft
Est. Value
About This Home
This home is located at 722 1/2 N 7th St, Marietta, OH 45750 and is currently estimated at $199,189, approximately $111 per square foot. 722 1/2 N 7th St is a home located in Washington County with nearby schools including Marietta High School, St. Mary Catholic School, and Veritas Classical Academy.
Ownership History
Date
Name
Owned For
Owner Type
Purchase Details
Closed on
Aug 22, 2016
Sold by
Kesselring Colleen M
Bought by
Standiford Jonathan D and Standiford Lisa M
Current Estimated Value
Home Financials for this Owner
Home Financials are based on the most recent Mortgage that was taken out on this home.
Original Mortgage
$70,000
Outstanding Balance
$43,739
Interest Rate
3.42%
Mortgage Type
New Conventional
Estimated Equity
$155,450
Purchase Details
Closed on
Jun 27, 2000
Bought by
Kesselring Zane B and Kesselring Coll
Purchase Details
Closed on
Feb 23, 1999
Bought by
Kesselring Lawrence H
Create a Home Valuation Report for This Property
The Home Valuation Report is an in-depth analysis detailing your home's value as well as a comparison with similar homes in the area
Home Values in the Area
Average Home Value in this Area
Purchase History
| Date | Buyer | Sale Price | Title Company |
|---|---|---|---|
| Standiford Jonathan D | $89,000 | Attorney | |
| Kesselring Zane B | -- | -- | |
| Kesselring Zane B | -- | -- | |
| Kesselring Lawrence H | -- | -- | |
| Kesselring Lawrence H | -- | -- |
Source: Public Records
Mortgage History
| Date | Status | Borrower | Loan Amount |
|---|---|---|---|
| Open | Standiford Jonathan D | $70,000 |
Source: Public Records
Tax History Compared to Growth
Tax History
| Year | Tax Paid | Tax Assessment Tax Assessment Total Assessment is a certain percentage of the fair market value that is determined by local assessors to be the total taxable value of land and additions on the property. | Land | Improvement |
|---|---|---|---|---|
| 2024 | $1,717 | $50,630 | $9,060 | $41,570 |
| 2023 | $1,717 | $50,630 | $9,060 | $41,570 |
| 2022 | $1,705 | $50,630 | $9,060 | $41,570 |
| 2021 | $1,595 | $44,930 | $7,880 | $37,050 |
| 2020 | $1,598 | $44,930 | $7,880 | $37,050 |
| 2019 | $1,601 | $44,930 | $7,880 | $37,050 |
| 2018 | $1,493 | $40,730 | $6,850 | $33,880 |
| 2017 | $1,490 | $40,730 | $6,850 | $33,880 |
| 2016 | $2,614 | $40,730 | $6,850 | $33,880 |
| 2015 | $1,401 | $37,630 | $7,050 | $30,580 |
| 2014 | $2,418 | $37,630 | $7,050 | $30,580 |
| 2013 | $1,415 | $37,630 | $7,050 | $30,580 |
Source: Public Records
Map
Nearby Homes
- 723 N 7th St
- 725 8th St
- 723 6th St
- 608 N 7th St
- 404, 404 1/2, 406 1/ E Montgomery St
- 722 1/2 3rd St
- 522 6th St
- 619 3rd St
- 615 Wooster St
- 202 Sacra Via St
- 101 Gibbons Place
- 503 3rd St
- 329 N 7th St
- 308 Gross Ave and Clifton St
- 316 5th St
- 977 Gilman Ave
- 315 Muskingum Dr
- 120 Woodcrest Dr
- 0 Academy Dr
- 1099 Colegate Dr