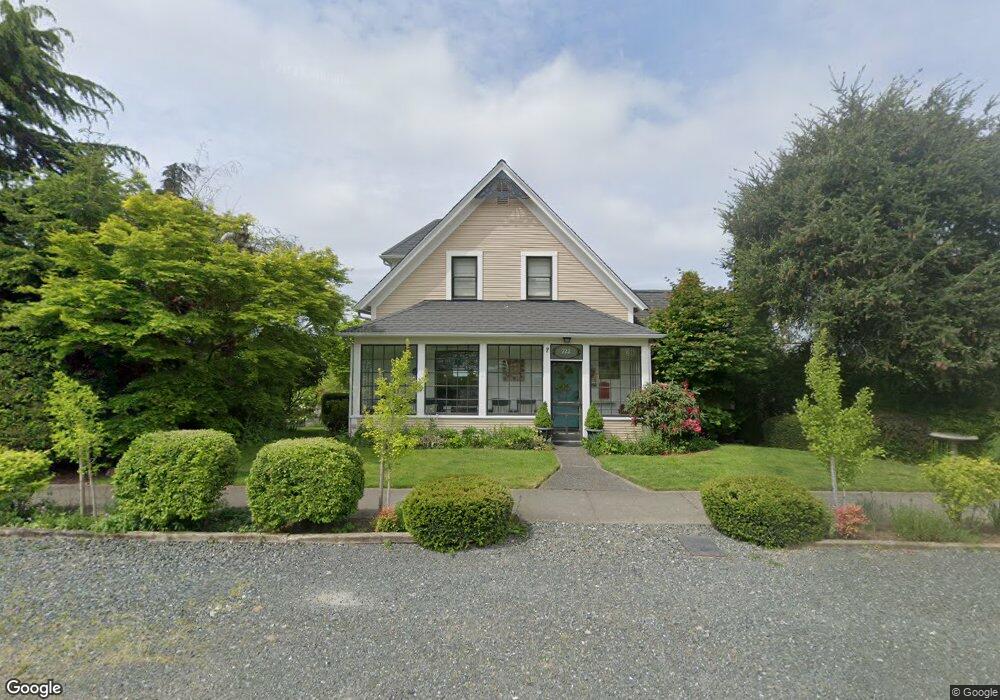
722 13th St Bellingham, WA 98225
South Hill NeighborhoodEstimated Value: $1,108,000 - $1,249,716
1
Bed
3
Baths
1,544
Sq Ft
$764/Sq Ft
Est. Value
About This Home
This home is located at 722 13th St, Bellingham, WA 98225 and is currently estimated at $1,179,429, approximately $763 per square foot. 722 13th St is a home located in Whatcom County with nearby schools including Lowell Elementary School, Fairhaven Middle School, and Sehome High School.
Ownership History
Date
Name
Owned For
Owner Type
Purchase Details
Closed on
Apr 20, 2006
Sold by
Sparks Dennis M and Sparks Shirley I
Bought by
Sparks Dennis M and Sparks Shirley I
Current Estimated Value
Purchase Details
Closed on
Feb 21, 2003
Sold by
Wassan Heidi A
Bought by
Sparks Dennis M and Sparks Shirley I
Home Financials for this Owner
Home Financials are based on the most recent Mortgage that was taken out on this home.
Original Mortgage
$215,000
Outstanding Balance
$84,801
Interest Rate
4.87%
Estimated Equity
$1,094,628
Purchase Details
Closed on
May 2, 2001
Sold by
Wassan Christain F
Bought by
Wassan Heidi A
Home Financials for this Owner
Home Financials are based on the most recent Mortgage that was taken out on this home.
Original Mortgage
$215,600
Interest Rate
6.89%
Create a Home Valuation Report for This Property
The Home Valuation Report is an in-depth analysis detailing your home's value as well as a comparison with similar homes in the area
Home Values in the Area
Average Home Value in this Area
Purchase History
| Date | Buyer | Sale Price | Title Company |
|---|---|---|---|
| Sparks Dennis M | -- | None Available | |
| Sparks Dennis M | $116,060 | First American Title Insuran | |
| Wassan Heidi A | -- | First American Title Insuran | |
| Sparks Dennis M | $269,500 | First American Title Insuran |
Source: Public Records
Mortgage History
| Date | Status | Borrower | Loan Amount |
|---|---|---|---|
| Open | Sparks Dennis M | $215,000 | |
| Previous Owner | Sparks Dennis M | $215,600 |
Source: Public Records
Tax History Compared to Growth
Tax History
| Year | Tax Paid | Tax Assessment Tax Assessment Total Assessment is a certain percentage of the fair market value that is determined by local assessors to be the total taxable value of land and additions on the property. | Land | Improvement |
|---|---|---|---|---|
| 2024 | $9,687 | $1,202,226 | $675,760 | $526,466 |
| 2023 | $9,687 | $1,245,208 | $699,920 | $545,288 |
| 2022 | $7,978 | $1,059,758 | $595,680 | $464,078 |
| 2021 | $7,579 | $854,666 | $480,400 | $374,266 |
| 2020 | $7,448 | $749,701 | $421,400 | $328,301 |
| 2019 | $5,366 | $711,629 | $400,000 | $311,629 |
| 2018 | $5,548 | $514,131 | $267,995 | $246,136 |
| 2017 | $4,894 | $456,363 | $237,880 | $218,483 |
| 2016 | $4,455 | $420,186 | $218,880 | $201,306 |
| 2015 | $4,385 | $398,480 | $207,480 | $191,000 |
| 2014 | -- | $379,497 | $197,600 | $181,897 |
| 2013 | -- | $361,763 | $190,000 | $171,763 |
Source: Public Records
Map
Nearby Homes
- 805 11th St
- 600 S State St Unit 208
- 600 S State St Unit 212
- 600 S State St Unit 101
- 600 S State St Unit 204
- 917 13th St
- 929 11th St Unit 202
- 925 15th St
- 1014 11th St Unit 302
- 1005 15th St
- 444 S State St Unit 307
- 1315 Mill Ave
- 0 XXX S State St
- 1201 13th St Unit 301
- 337 S State St Unit 2
- 1211 14th St
- 1131 16th St
- 910 Harris Ave Unit 208
- 1101 Mckenzie Ave Unit 206
- 1302 Larrabee Ave