722 B St Fernley, NV 89408
Estimated Value: $278,000 - $347,000
3
Beds
2
Baths
1,426
Sq Ft
$228/Sq Ft
Est. Value
About This Home
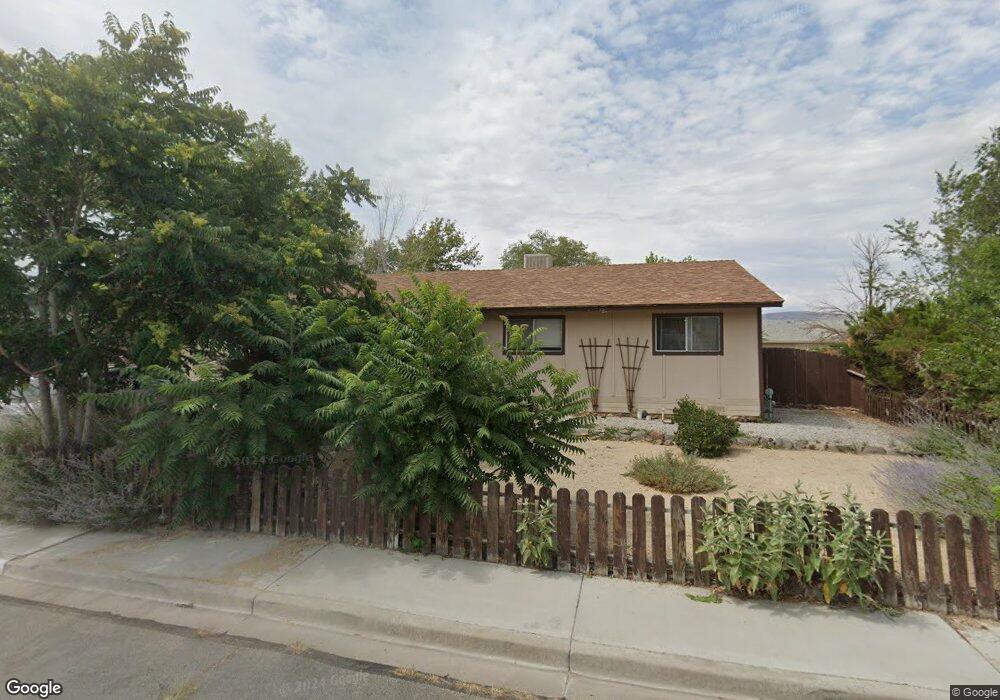
This home is located at 722 B St, Fernley, NV 89408 and is currently estimated at $324,782, approximately $227 per square foot. 722 B St is a home located in Lyon County with nearby schools including Fernley Elementary School, Fernley Intermediate School, and Fernley High School.
Ownership History
Date
Name
Owned For
Owner Type
Purchase Details
Closed on
Oct 3, 2019
Sold by
Hewet Amy Fruge and Hewett Amy
Bought by
Hewett Amy Fruge and Hewett Amy Fruge
Current Estimated Value
Purchase Details
Closed on
Apr 7, 2010
Sold by
U S Bank National Association
Bought by
Hewett Amy
Purchase Details
Closed on
Mar 8, 2010
Sold by
Ogrady Vanessa J
Bought by
U S Bank National Association
Purchase Details
Closed on
Apr 11, 2006
Sold by
Ogrady Vanessa J and Perry James C
Bought by
Cmg-3 Lp
Purchase Details
Closed on
Apr 4, 2006
Sold by
Ogrady Vanessa J
Bought by
Ogrady Vanessa J and Perry James C
Purchase Details
Closed on
Jan 17, 2006
Sold by
Whyte Mary V
Bought by
Ogrady Vanessa J
Home Financials for this Owner
Home Financials are based on the most recent Mortgage that was taken out on this home.
Original Mortgage
$172,000
Interest Rate
2.5%
Create a Home Valuation Report for This Property
The Home Valuation Report is an in-depth analysis detailing your home's value as well as a comparison with similar homes in the area
Home Values in the Area
Average Home Value in this Area
Purchase History
| Date | Buyer | Sale Price | Title Company |
|---|---|---|---|
| Hewett Amy Fruge | -- | None Available | |
| Hewett Amy | $71,300 | Ticor Title Of Nevada Inc | |
| U S Bank National Association | $57,800 | Stewart Title | |
| Cmg-3 Lp | $215,000 | Accommodation | |
| Perry James C | $215,000 | Accommodation | |
| Ogrady Vanessa J | $140,000 | Founders Title Co Of Nevada | |
| Ogrady Vanessa J | $215,000 | Founders Title Co Of Nevada |
Source: Public Records
Mortgage History
| Date | Status | Borrower | Loan Amount |
|---|---|---|---|
| Previous Owner | Ogrady Vanessa J | $172,000 |
Source: Public Records
Tax History Compared to Growth
Tax History
| Year | Tax Paid | Tax Assessment Tax Assessment Total Assessment is a certain percentage of the fair market value that is determined by local assessors to be the total taxable value of land and additions on the property. | Land | Improvement |
|---|---|---|---|---|
| 2025 | $972 | $84,319 | $61,250 | $23,069 |
| 2024 | $1,353 | $85,155 | $61,250 | $23,905 |
| 2023 | $1,353 | $84,184 | $61,250 | $22,934 |
| 2022 | $1,281 | $82,993 | $61,250 | $21,743 |
| 2021 | $1,281 | $65,466 | $43,750 | $21,716 |
| 2020 | $1,251 | $64,875 | $43,750 | $21,125 |
| 2019 | $1,242 | $64,496 | $43,750 | $20,746 |
| 2018 | $1,222 | $52,151 | $31,500 | $20,651 |
| 2017 | $1,231 | $44,998 | $23,980 | $21,018 |
| 2016 | $1,055 | $28,446 | $6,300 | $22,146 |
| 2015 | $1,091 | $24,987 | $6,300 | $18,687 |
| 2014 | $1,070 | $20,018 | $6,300 | $13,718 |
Source: Public Records
Map
Nearby Homes