Estimated Value: $1,047,000 - $1,263,000
3
Beds
2
Baths
1,717
Sq Ft
$673/Sq Ft
Est. Value
About This Home
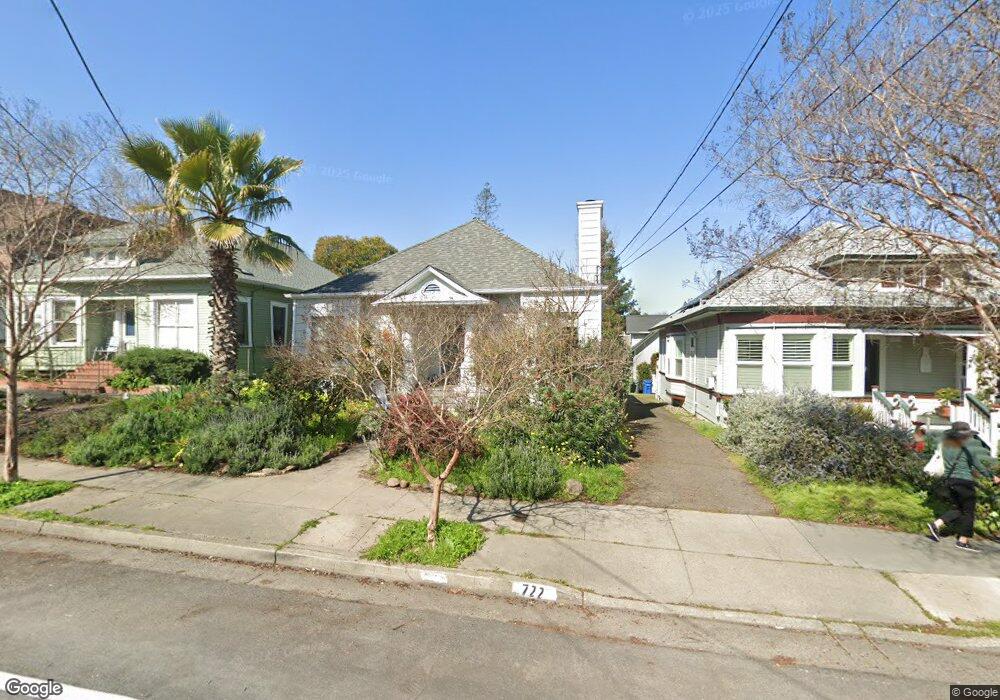
This home is located at 722 B St, Petaluma, CA 94952 and is currently estimated at $1,155,220, approximately $672 per square foot. 722 B St is a home located in Sonoma County with nearby schools including McNear Elementary School, Petaluma Junior High School, and Petaluma High School.
Ownership History
Date
Name
Owned For
Owner Type
Purchase Details
Closed on
Jan 11, 2022
Sold by
Moore Madeline A and Moore Frank H
Bought by
Moore Frank H and Moore Madeline
Current Estimated Value
Home Financials for this Owner
Home Financials are based on the most recent Mortgage that was taken out on this home.
Original Mortgage
$378,000
Outstanding Balance
$346,050
Interest Rate
3.22%
Mortgage Type
New Conventional
Estimated Equity
$809,170
Purchase Details
Closed on
Aug 15, 2018
Sold by
Moore Frank H and Moore Madeline A
Bought by
Moore Frank H and Moore Madeline A
Purchase Details
Closed on
Aug 3, 1998
Sold by
Womack Wayne and Womack Colleen
Bought by
Moore Frank Hunt and Moore Madeline A
Home Financials for this Owner
Home Financials are based on the most recent Mortgage that was taken out on this home.
Original Mortgage
$239,200
Interest Rate
6.93%
Create a Home Valuation Report for This Property
The Home Valuation Report is an in-depth analysis detailing your home's value as well as a comparison with similar homes in the area
Home Values in the Area
Average Home Value in this Area
Purchase History
| Date | Buyer | Sale Price | Title Company |
|---|---|---|---|
| Moore Frank H | -- | First American Title | |
| Moore Madeline A | -- | First American Title | |
| Moore Frank H | -- | None Available | |
| Moore Frank H | -- | None Available | |
| Moore Frank Hunt | $299,000 | First American Title |
Source: Public Records
Mortgage History
| Date | Status | Borrower | Loan Amount |
|---|---|---|---|
| Open | Moore Madeline A | $378,000 | |
| Previous Owner | Moore Frank Hunt | $239,200 |
Source: Public Records
Tax History
| Year | Tax Paid | Tax Assessment Tax Assessment Total Assessment is a certain percentage of the fair market value that is determined by local assessors to be the total taxable value of land and additions on the property. | Land | Improvement |
|---|---|---|---|---|
| 2025 | $5,208 | $473,344 | $376,250 | $97,094 |
| 2024 | $5,208 | $464,064 | $368,873 | $95,191 |
| 2023 | $5,208 | $454,966 | $361,641 | $93,325 |
| 2022 | $5,018 | $446,046 | $354,550 | $91,496 |
| 2021 | $4,924 | $437,301 | $347,599 | $89,702 |
| 2020 | $4,966 | $432,818 | $344,035 | $88,783 |
| 2019 | $4,906 | $424,333 | $337,290 | $87,043 |
| 2018 | $4,887 | $416,014 | $330,677 | $85,337 |
| 2017 | $4,786 | $407,858 | $324,194 | $83,664 |
| 2016 | $4,671 | $399,862 | $317,838 | $82,024 |
| 2015 | $4,607 | $393,856 | $313,064 | $80,792 |
| 2014 | $4,585 | $386,142 | $306,932 | $79,210 |
Source: Public Records
Map
Nearby Homes
- 131 Liberty St
- 136 Court St
- 301 Broadway St
- 617 G St
- 519 7th St
- 100 Orchard Ln
- 1309 D Street Extension
- 426 1st St
- 12 Haven Dr
- 852 Western Ave
- 611 Petaluma Blvd S
- 331 Keller St Unit 6
- 720 Petaluma Blvd S Unit 28
- 21 Branching Way
- 510 Kent St
- 512 Keller St
- 512 Kentucky St
- 0 Lakeville St
- 315 Lakeville St
- 156 Grant Ct
Your Personal Tour Guide
Ask me questions while you tour the home.