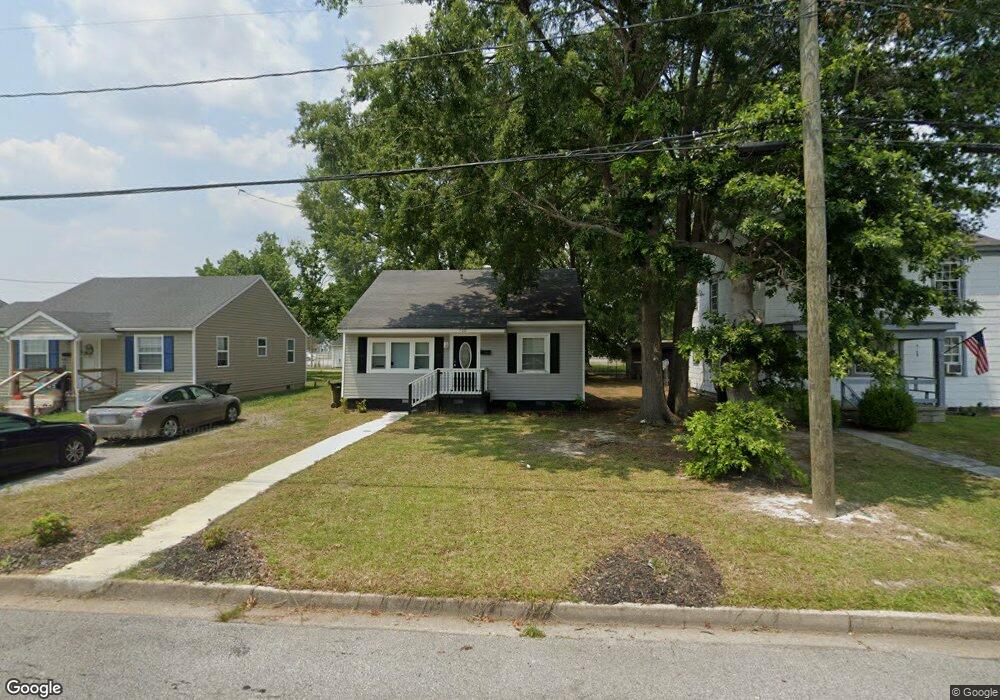
722 Bolling St Franklin, VA 23851
Estimated Value: $94,000 - $155,555
2
Beds
1
Bath
924
Sq Ft
$137/Sq Ft
Est. Value
About This Home
This home is located at 722 Bolling St, Franklin, VA 23851 and is currently estimated at $126,389, approximately $136 per square foot. 722 Bolling St is a home located in Franklin City with nearby schools including S.P. Morton Elementary School, Joseph P. King Jr. Middle School, and Franklin High School.
Ownership History
Date
Name
Owned For
Owner Type
Purchase Details
Closed on
Aug 20, 2024
Sold by
Matos Rebecca Rose and Rose Mina Rebecca
Bought by
Andrews Gwendolyn J
Current Estimated Value
Purchase Details
Closed on
Jun 27, 2022
Sold by
Toxey Aubrey K and Toxey Debora W
Bought by
Matos Rebecca Rose
Home Financials for this Owner
Home Financials are based on the most recent Mortgage that was taken out on this home.
Original Mortgage
$104,000
Interest Rate
5.25%
Mortgage Type
New Conventional
Create a Home Valuation Report for This Property
The Home Valuation Report is an in-depth analysis detailing your home's value as well as a comparison with similar homes in the area
Home Values in the Area
Average Home Value in this Area
Purchase History
We collect this data history from publicly available records. To have your information removed, we recommend requesting removal directly through your county’s website.
| Date | Buyer | Sale Price | Title Company |
|---|---|---|---|
| Andrews Gwendolyn J | $140,000 | None Listed On Document | |
| Matos Rebecca Rose | $130,000 | New Title Company Name |
Source: Public Records
Mortgage History
We collect this data history from publicly available records. To have your information removed, we recommend requesting removal directly through your county’s website.
| Date | Status | Borrower | Loan Amount |
|---|---|---|---|
| Previous Owner | Matos Rebecca Rose | $104,000 |
Source: Public Records
Tax History
| Year | Tax Paid | Tax Assessment Tax Assessment Total Assessment is a certain percentage of the fair market value that is determined by local assessors to be the total taxable value of land and additions on the property. | Land | Improvement |
|---|---|---|---|---|
| 2025 | $783 | $76,000 | $16,500 | $59,500 |
| 2024 | $783 | $76,000 | $16,500 | $59,500 |
| 2023 | $474 | $46,000 | $7,400 | $38,600 |
| 2022 | $474 | $46,000 | $7,400 | $38,600 |
| 2021 | $448 | $43,500 | $6,800 | $36,700 |
| 2020 | $395 | $43,500 | $6,800 | $36,700 |
| 2019 | $395 | $39,900 | $6,800 | $33,100 |
| 2018 | $395 | $39,900 | $6,800 | $33,100 |
| 2017 | $425 | $42,900 | $14,200 | $28,700 |
| 2016 | $425 | $42,900 | $14,200 | $28,700 |
| 2015 | -- | $0 | $0 | $0 |
| 2014 | -- | $0 | $0 | $0 |
| 2013 | -- | $0 | $0 | $0 |
Source: Public Records
Map
Nearby Homes
Your Personal Tour Guide
Ask me questions while you tour the home.