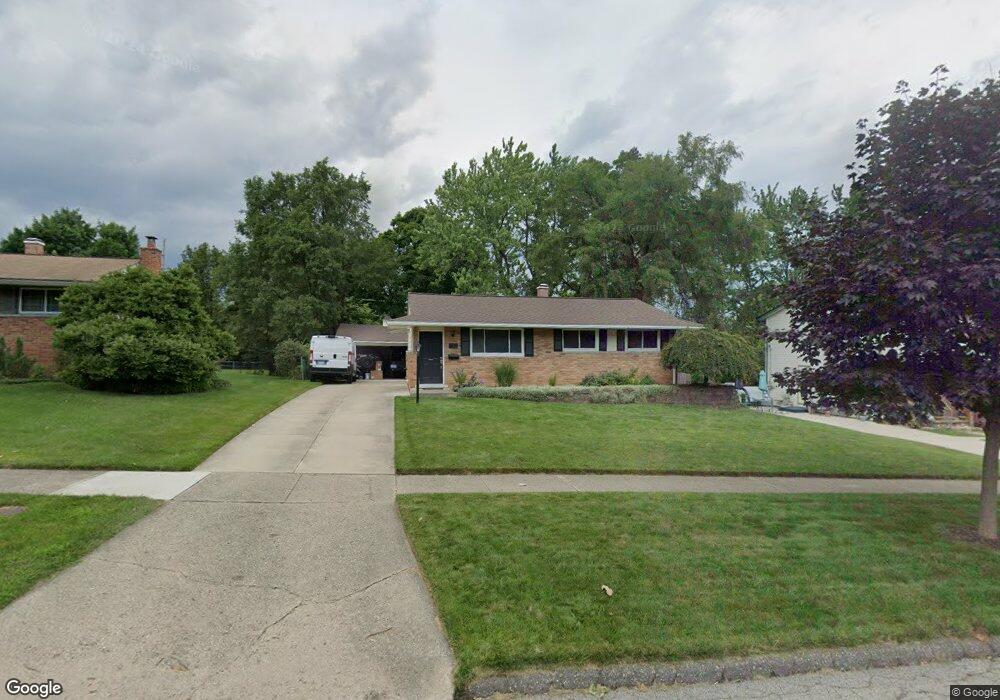
722 Byron Dr Milford, MI 48381
Estimated Value: $297,773 - $362,000
3
Beds
2
Baths
1,100
Sq Ft
$300/Sq Ft
Est. Value
About This Home
This home is located at 722 Byron Dr, Milford, MI 48381 and is currently estimated at $329,943, approximately $299 per square foot. 722 Byron Dr is a home located in Oakland County with nearby schools including Johnson Elementary School, Muir Middle School, and Christ Lutheran Christian Day School.
Ownership History
Date
Name
Owned For
Owner Type
Purchase Details
Closed on
Jul 16, 2009
Sold by
Mauck Eric M and Mauck Krista
Bought by
Rowley Anthony P
Current Estimated Value
Home Financials for this Owner
Home Financials are based on the most recent Mortgage that was taken out on this home.
Original Mortgage
$146,132
Outstanding Balance
$95,699
Interest Rate
5.62%
Mortgage Type
FHA
Estimated Equity
$234,244
Purchase Details
Closed on
May 26, 1999
Sold by
Marino Alfred
Bought by
Mauck Eric
Home Financials for this Owner
Home Financials are based on the most recent Mortgage that was taken out on this home.
Original Mortgage
$133,896
Interest Rate
7.06%
Purchase Details
Closed on
Jun 30, 1998
Sold by
Readler Robert R
Bought by
Marino Alfred C
Home Financials for this Owner
Home Financials are based on the most recent Mortgage that was taken out on this home.
Original Mortgage
$101,520
Interest Rate
7.03%
Create a Home Valuation Report for This Property
The Home Valuation Report is an in-depth analysis detailing your home's value as well as a comparison with similar homes in the area
Home Values in the Area
Average Home Value in this Area
Purchase History
| Date | Buyer | Sale Price | Title Company |
|---|---|---|---|
| Rowley Anthony P | $148,829 | Multiple | |
| Mauck Eric | $135,000 | -- | |
| Marino Alfred C | $126,900 | -- |
Source: Public Records
Mortgage History
| Date | Status | Borrower | Loan Amount |
|---|---|---|---|
| Open | Rowley Anthony P | $146,132 | |
| Previous Owner | Mauck Eric | $133,896 | |
| Previous Owner | Marino Alfred C | $101,520 |
Source: Public Records
Tax History
| Year | Tax Paid | Tax Assessment Tax Assessment Total Assessment is a certain percentage of the fair market value that is determined by local assessors to be the total taxable value of land and additions on the property. | Land | Improvement |
|---|---|---|---|---|
| 2025 | $2,498 | $127,910 | $0 | $0 |
| 2024 | $2,178 | $119,950 | $0 | $0 |
| 2023 | $2,085 | $110,850 | $0 | $0 |
| 2022 | $2,758 | $103,490 | $0 | $0 |
| 2021 | $1,546 | $99,350 | $0 | $0 |
| 2020 | $1,927 | $96,410 | $0 | $0 |
| 2019 | $1,949 | $92,160 | $0 | $0 |
| 2018 | $1,924 | $84,890 | $0 | $0 |
| 2017 | $1,026 | $84,890 | $0 | $0 |
| 2016 | $2,398 | $78,810 | $0 | $0 |
| 2015 | -- | $73,170 | $0 | $0 |
| 2014 | -- | $62,530 | $0 | $0 |
| 2011 | -- | $58,150 | $0 | $0 |
Source: Public Records
Map
Nearby Homes
- 710 Bellevue
- 110 Oakland St
- 759 Hilldale Cir
- 312 Dorchester Way
- 431 W Washington St
- 524 W Huron St
- 301 River Wood Trail
- 564 Dorchester Way Unit 16
- 114 River Dr Unit A
- 144 River Dr Unit D
- 130 River Dr Unit ABD
- 124 River Dr Unit B
- 778 S Milford Rd Unit 37
- 738 S Milford Rd Unit 30
- 007 S Milford Rd
- 134 River Dr
- 226 Franklin St
- 120 E Liberty St Unit 304
- 120 E Liberty St Unit 303
- 120 E Liberty St Unit 207
- 734 Byron Dr
- 708 Byron Dr
- 710 S Main St
- 746 Byron Dr
- 721 Byron Dr
- 737 Byron Dr
- 707 Byron Dr
- 772 Byron Ct Unit Bldg-Unit
- 772 Byron Ct
- 121 Turnberry Ct Unit 1
- 753 Byron Dr
- 104 2nd St
- 135 Turnberry Ct Unit 2
- 18035 S Main St
- 778 Byron Ct
- 149 Turnberry Ct Unit 3
- 522 Hilldale Cir
- 120 Shelley Dr
- 108 Shelley Dr
- 769 Byron Dr
Your Personal Tour Guide
Ask me questions while you tour the home.