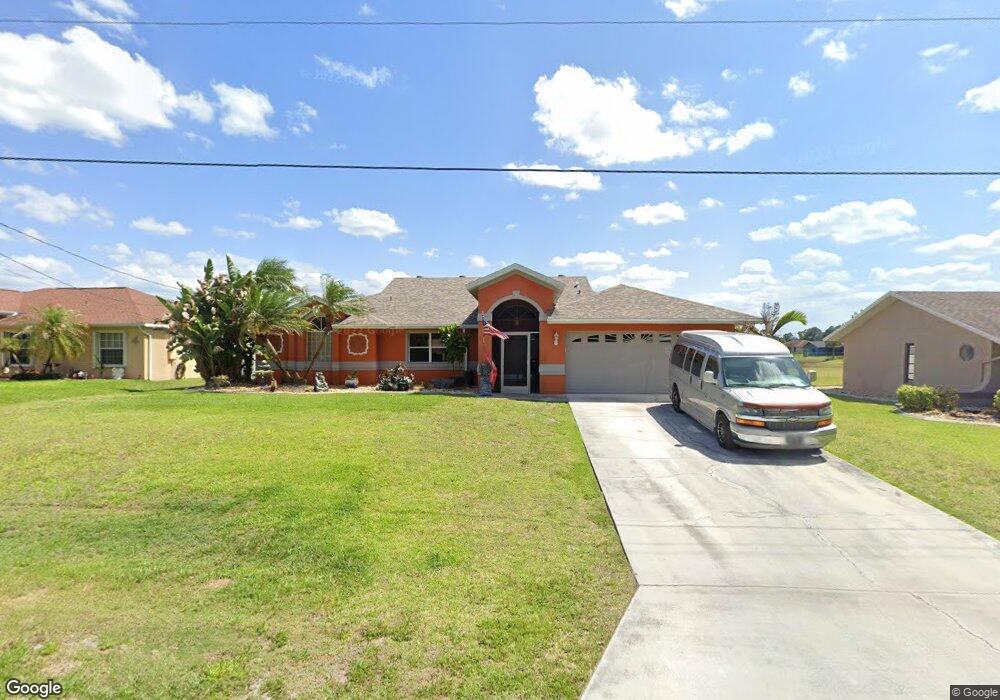
722 Chavers St Unit 13 Lehigh Acres, FL 33974
Eisenhower NeighborhoodEstimated Value: $332,000 - $497,000
3
Beds
3
Baths
2,428
Sq Ft
$161/Sq Ft
Est. Value
About This Home
This home is located at 722 Chavers St Unit 13, Lehigh Acres, FL 33974 and is currently estimated at $391,493, approximately $161 per square foot. 722 Chavers St Unit 13 is a home located in Lee County with nearby schools including Lehigh Elementary School, The Alva School, and Gateway Elementary School.
Ownership History
Date
Name
Owned For
Owner Type
Purchase Details
Closed on
Feb 1, 2022
Sold by
Whiteleather Smith Margaret
Bought by
Whiteleather Atlee Charles
Current Estimated Value
Purchase Details
Closed on
Jul 15, 2012
Sold by
Smith Margaret W
Bought by
Smith Margaret W and Whiteleather Atlee C
Purchase Details
Closed on
Nov 4, 2011
Sold by
Smith Kenneth R
Bought by
Smith Margaret W
Purchase Details
Closed on
Aug 27, 2009
Sold by
Federal Home Loan Mortgage Corporation
Bought by
Smith Kenneth R
Purchase Details
Closed on
Jul 24, 2009
Sold by
Shumate David and Shumate Cindy
Bought by
Wells Fargo Bank Na
Purchase Details
Closed on
Jul 17, 2009
Sold by
Wells Fargo Bank Na
Bought by
Federal Home Loan Mortgage Corp
Purchase Details
Closed on
Jun 14, 1997
Sold by
Messmer Clifford L and Messmer Norma E
Bought by
Shumate David L and Shumate Cindy A
Home Financials for this Owner
Home Financials are based on the most recent Mortgage that was taken out on this home.
Original Mortgage
$122,850
Interest Rate
7.61%
Create a Home Valuation Report for This Property
The Home Valuation Report is an in-depth analysis detailing your home's value as well as a comparison with similar homes in the area
Home Values in the Area
Average Home Value in this Area
Purchase History
| Date | Buyer | Sale Price | Title Company |
|---|---|---|---|
| Whiteleather Atlee Charles | -- | None Listed On Document | |
| Smith Margaret W | -- | None Available | |
| Smith Margaret W | -- | Attorney | |
| Smith Kenneth R | $94,500 | New House Title Llc | |
| Wells Fargo Bank Na | -- | Attorney | |
| Federal Home Loan Mortgage Corp | -- | Attorney | |
| Shumate David L | $13,000 | -- |
Source: Public Records
Mortgage History
| Date | Status | Borrower | Loan Amount |
|---|---|---|---|
| Previous Owner | Shumate David L | $122,850 |
Source: Public Records
Tax History
| Year | Tax Paid | Tax Assessment Tax Assessment Total Assessment is a certain percentage of the fair market value that is determined by local assessors to be the total taxable value of land and additions on the property. | Land | Improvement |
|---|---|---|---|---|
| 2025 | $4,590 | $360,051 | -- | -- |
| 2024 | $4,219 | $349,904 | $17,443 | $275,610 |
| 2023 | $4,481 | $342,343 | $0 | $0 |
| 2022 | $4,219 | $327,598 | $16,196 | $311,402 |
| 2021 | $3,588 | $235,336 | $11,548 | $223,788 |
| 2020 | $3,479 | $221,263 | $6,800 | $214,463 |
| 2019 | $3,270 | $209,948 | $6,800 | $203,148 |
| 2018 | $3,027 | $186,530 | $6,400 | $180,130 |
| 2017 | $2,985 | $192,189 | $3,000 | $189,189 |
| 2016 | $2,729 | $166,237 | $5,388 | $160,849 |
| 2015 | $2,472 | $142,806 | $5,066 | $137,740 |
| 2014 | $2,389 | $128,000 | $4,607 | $123,393 |
| 2013 | -- | $117,602 | $3,195 | $114,407 |
Source: Public Records
Map
Nearby Homes
- 646/648 Chavers St
- 726 Chavers St
- 735 Chavers St
- 490 Lemhurst Ave S
- 715 Theodore Vail St E
- 740 Chestnut St E
- 717 Theodore Vail St E
- 743 Chestnut St E
- 718 Chambers St E
- 716 Chambers St E
- 755 Chambers St E
- 706 Theodore Vail St E
- 710 Theodore Vail St E
- 405-407 Chalet Ave S
- 748 Chestnut St E
- 745 Grant Blvd Unit 10
- 727 Central St E
- 519 Genesee Ave S
- 750 Chambers St E
- 726 Clancy St E
- 720 Chavers St
- 724 Chavers St Unit 13
- 720 Chavers St E
- 718 Chavers St Unit 5
- 718 Chavers St
- 726 Chavers St Unit 9
- 725 Chavers St
- 719 Chavers St
- 730 Chavers St
- 716 Chavers St
- 614 Chavers St
- 668 Chavers St
- 721 Chavers St
- 676 Chavers St
- 680 Chavers St
- 723 Chavers St Unit 18
- 723 Chavers St
- 727 Chavers St
- 729 Chavers St
- 481 Labree Ave S
Your Personal Tour Guide
Ask me questions while you tour the home.