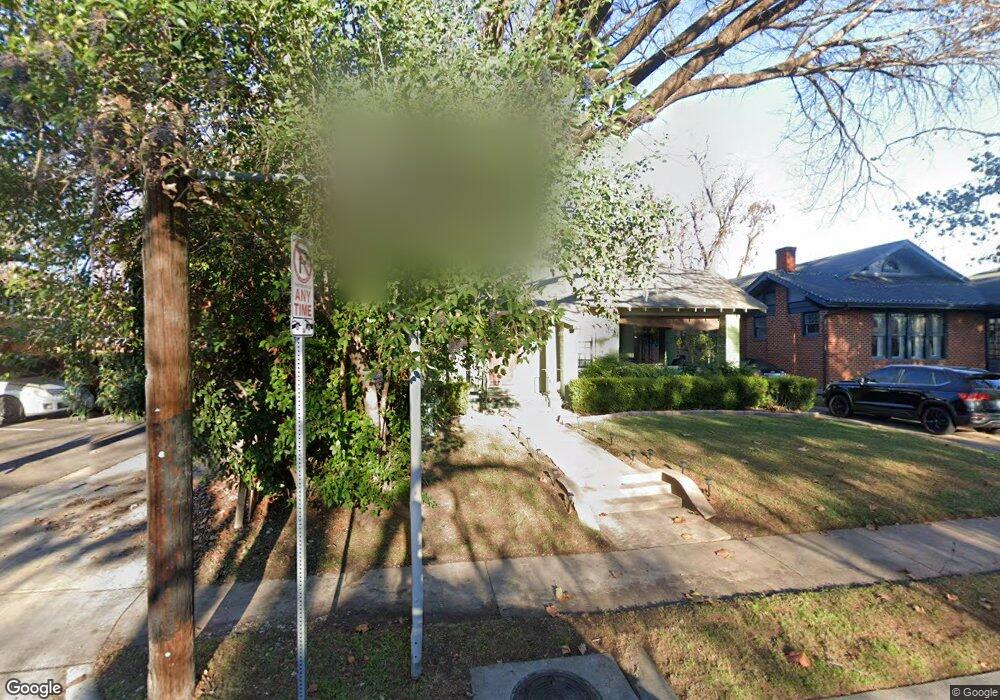
722 Dumas St Dallas, TX 75214
Old East Dallas NeighborhoodEstimated Value: $433,139 - $614,000
3
Beds
2
Baths
1,802
Sq Ft
$302/Sq Ft
Est. Value
About This Home
This home is located at 722 Dumas St, Dallas, TX 75214 and is currently estimated at $544,285, approximately $302 per square foot. 722 Dumas St is a home located in Dallas County with nearby schools including William Lipscomb Elementary School, J L Long Middle School, and Woodrow Wilson High School.
Ownership History
Date
Name
Owned For
Owner Type
Purchase Details
Closed on
Apr 25, 2002
Sold by
Penfold Craig
Bought by
Patel Rakhee
Current Estimated Value
Home Financials for this Owner
Home Financials are based on the most recent Mortgage that was taken out on this home.
Original Mortgage
$204,250
Outstanding Balance
$85,818
Interest Rate
7%
Estimated Equity
$458,467
Purchase Details
Closed on
Sep 5, 2001
Sold by
Sadacca David Chase
Bought by
Penfold Craig
Home Financials for this Owner
Home Financials are based on the most recent Mortgage that was taken out on this home.
Original Mortgage
$160,000
Interest Rate
6.96%
Purchase Details
Closed on
May 16, 2000
Sold by
Johnson Larry Lee
Bought by
Sadacca David Chase
Home Financials for this Owner
Home Financials are based on the most recent Mortgage that was taken out on this home.
Original Mortgage
$139,500
Interest Rate
8.19%
Mortgage Type
Seller Take Back
Create a Home Valuation Report for This Property
The Home Valuation Report is an in-depth analysis detailing your home's value as well as a comparison with similar homes in the area
Home Values in the Area
Average Home Value in this Area
Purchase History
| Date | Buyer | Sale Price | Title Company |
|---|---|---|---|
| Patel Rakhee | -- | -- | |
| Penfold Craig | -- | -- | |
| Sadacca David Chase | -- | -- |
Source: Public Records
Mortgage History
| Date | Status | Borrower | Loan Amount |
|---|---|---|---|
| Open | Patel Rakhee | $204,250 | |
| Previous Owner | Penfold Craig | $160,000 | |
| Previous Owner | Sadacca David Chase | $139,500 |
Source: Public Records
Tax History Compared to Growth
Tax History
| Year | Tax Paid | Tax Assessment Tax Assessment Total Assessment is a certain percentage of the fair market value that is determined by local assessors to be the total taxable value of land and additions on the property. | Land | Improvement |
|---|---|---|---|---|
| 2025 | $6,829 | $305,540 | $146,880 | $158,660 |
| 2024 | $6,829 | $305,540 | $146,880 | $158,660 |
| 2023 | $6,829 | $287,220 | $146,880 | $140,340 |
| 2022 | $11,290 | $449,750 | $0 | $0 |
| 2021 | $8,813 | $334,070 | $146,880 | $187,190 |
| 2020 | $8,625 | $317,930 | $0 | $0 |
| 2019 | $6,910 | $242,850 | $102,820 | $140,030 |
| 2018 | $5,765 | $212,000 | $58,750 | $153,250 |
| 2017 | $5,765 | $212,000 | $58,750 | $153,250 |
| 2016 | $5,765 | $212,000 | $58,750 | $153,250 |
| 2015 | $5,815 | $212,000 | $58,750 | $153,250 |
| 2014 | $5,815 | $212,000 | $58,750 | $153,250 |
Source: Public Records
Map
Nearby Homes
- 5320 Junius St
- 5322 Junius St
- 5314 Swiss Ave
- 5020 Junius St
- 700 N Beacon St
- 5425 Victor St
- 5502 Victor St
- 711 Glendale St
- 4940 Worth St
- 5401 Reiger Ave
- 5820 Bryan Pkwy Unit 10
- 5810 Bryan Pkwy Unit 100
- 5320 Reiger Ave Unit 102
- 5320 Reiger Ave Unit 101-108
- 4916 Junius St
- 5605 Reiger Ave
- 5620 Live Oak St Unit 104
- 5620 Live Oak St Unit 106
- 5530 Reiger Ave
- 218 N Beacon St Unit 108
- 718 Dumas St
- 714 Dumas St
- 5406 Gaston Ave
- 5402 Gaston Ave
- 710 Dumas St
- 723 Dumont St
- 719 Dumont St
- 5416 Gaston Ave
- 5327 Junius St
- 715 Dumont St
- 706 Dumas St
- 5324 Gaston Ave Unit 101
- 5324 Gaston Ave Unit 201
- 711 Dumont St
- 707 Dumont St
- 700 Dumas St
- 5317 Junius St
- 5317 Junius St Unit 104
- 5317 Junius St Unit 213
- 5317 Junius St Unit 209