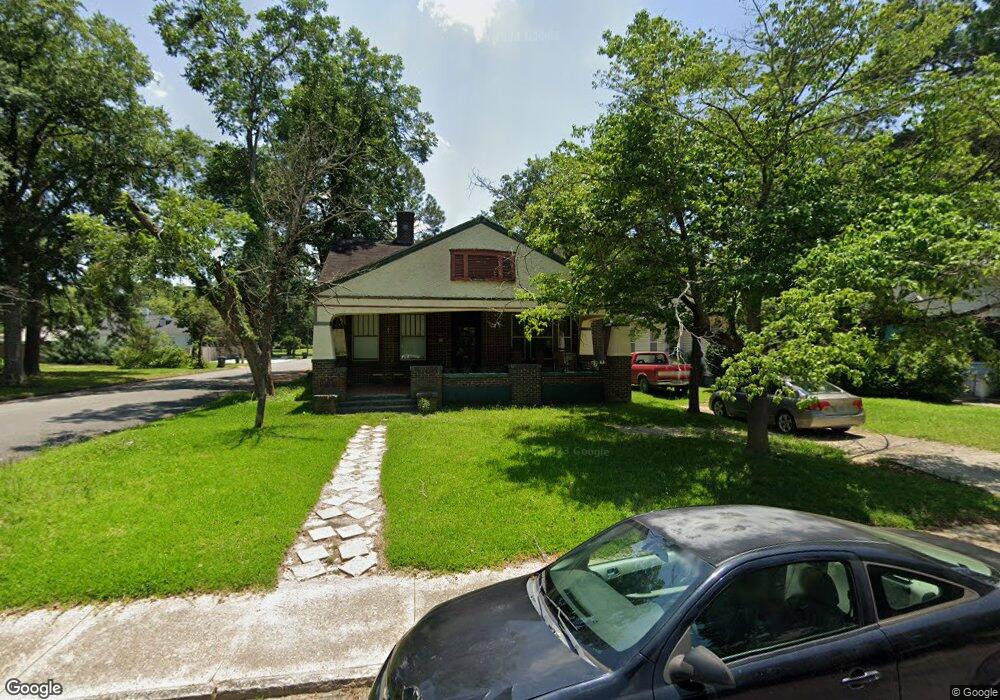
722 E 13th Ave Cordele, GA 31015
Estimated Value: $63,000 - $133,752
2
Beds
2
Baths
2,340
Sq Ft
$43/Sq Ft
Est. Value
About This Home
This home is located at 722 E 13th Ave, Cordele, GA 31015 and is currently estimated at $101,188, approximately $43 per square foot. 722 E 13th Ave is a home located in Crisp County with nearby schools including Crisp County Elementary School, Crisp County Primary School, and Crisp County Middle School.
Ownership History
Date
Name
Owned For
Owner Type
Purchase Details
Closed on
Jul 21, 2020
Sold by
Mathis Nesbitt E
Bought by
Mercer Angela
Current Estimated Value
Purchase Details
Closed on
Dec 2, 2002
Sold by
First Union National Bank Of Delaware
Bought by
Mathis Nesbit E
Purchase Details
Closed on
Nov 6, 2001
Sold by
Parker Daniel and Parker Nancy
Bought by
First Union National Bank Of Delware
Purchase Details
Closed on
Feb 13, 1996
Sold by
Mcleod Benjamin S
Bought by
Parker Daniel and Parker Nancy
Purchase Details
Closed on
Jun 1, 1995
Sold by
Mcleod Elizabeth S
Bought by
Mcleod Benjamin S
Purchase Details
Closed on
Dec 20, 1976
Sold by
Shaffer Mrs Verna F
Bought by
Mcleod Elizabeth S
Purchase Details
Closed on
Nov 9, 1959
Bought by
Shaffer Mrs Verna F
Create a Home Valuation Report for This Property
The Home Valuation Report is an in-depth analysis detailing your home's value as well as a comparison with similar homes in the area
Purchase History
| Date | Buyer | Sale Price | Title Company |
|---|---|---|---|
| Mercer Angela | $40,000 | -- | |
| Mathis Nesbit E | $40,000 | -- | |
| First Union National Bank Of Delware | -- | -- | |
| Parker Daniel | $75,000 | -- | |
| Mcleod Benjamin S | -- | -- | |
| Mcleod Elizabeth S | -- | -- | |
| Shaffer Mrs Verna F | -- | -- |
Source: Public Records
Tax History
| Year | Tax Paid | Tax Assessment Tax Assessment Total Assessment is a certain percentage of the fair market value that is determined by local assessors to be the total taxable value of land and additions on the property. | Land | Improvement |
|---|---|---|---|---|
| 2025 | $1,620 | $45,927 | $1,536 | $44,391 |
| 2024 | $1,479 | $41,270 | $1,536 | $39,734 |
| 2023 | $1,460 | $38,942 | $1,536 | $37,406 |
| 2022 | $823 | $36,614 | $1,536 | $35,078 |
| 2021 | $806 | $34,286 | $1,536 | $32,750 |
| 2020 | $965 | $34,286 | $1,536 | $32,750 |
| 2019 | $972 | $34,286 | $1,536 | $32,750 |
| 2018 | $399 | $13,524 | $1,536 | $11,988 |
| 2017 | $521 | $12,820 | $1,536 | $11,284 |
| 2016 | $379 | $12,820 | $1,536 | $11,284 |
| 2015 | -- | $12,820 | $1,536 | $11,284 |
| 2014 | -- | $12,820 | $1,536 | $11,284 |
| 2013 | -- | $12,820 | $1,536 | $11,284 |
Source: Public Records
Map
Nearby Homes
Your Personal Tour Guide
Ask me questions while you tour the home.