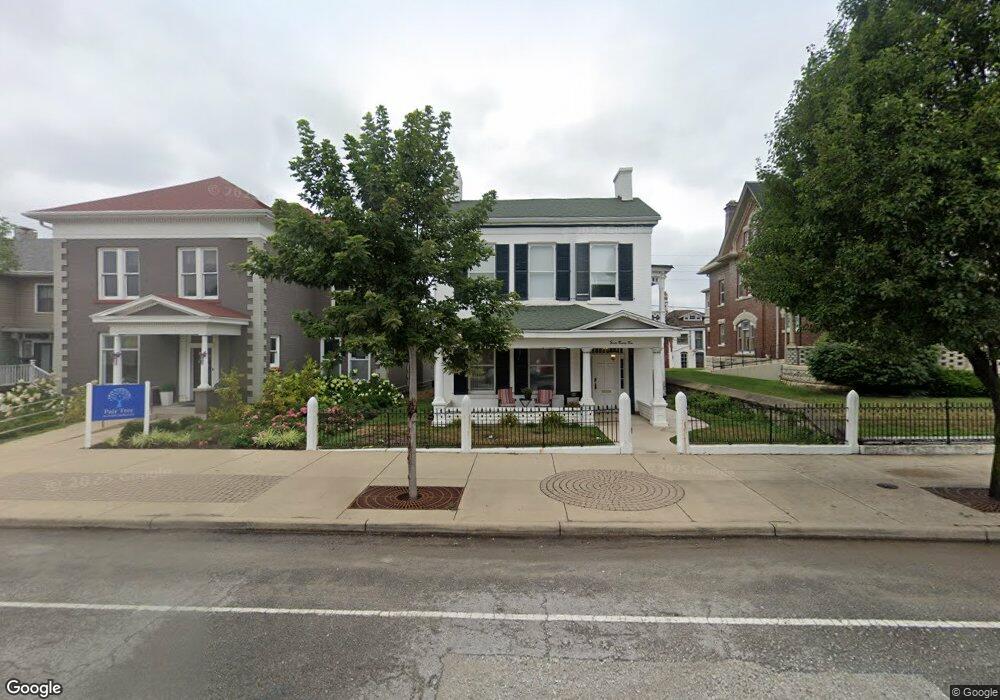
722 E Broadway Logansport, IN 46947
Estimated Value: $184,691 - $211,000
4
Beds
1
Bath
3,632
Sq Ft
$55/Sq Ft
Est. Value
About This Home
This home is located at 722 E Broadway, Logansport, IN 46947 and is currently estimated at $200,564, approximately $55 per square foot. 722 E Broadway is a home located in Cass County with nearby schools including Logansport Community High School and All Saints Catholic School.
Ownership History
Date
Name
Owned For
Owner Type
Purchase Details
Closed on
Mar 7, 2017
Sold by
Foreman David W
Bought by
Leeman William Kelly and Leeman Pamela A
Current Estimated Value
Home Financials for this Owner
Home Financials are based on the most recent Mortgage that was taken out on this home.
Original Mortgage
$117,500
Outstanding Balance
$77,731
Interest Rate
4.16%
Mortgage Type
New Conventional
Estimated Equity
$122,833
Purchase Details
Closed on
Apr 16, 2014
Sold by
Diane M Coffing
Bought by
Foreman David W and Foreman Andrea M
Purchase Details
Closed on
Jul 15, 2013
Sold by
Diane Coffing - Signer
Bought by
Foreman David W and Foreman Andrea M
Create a Home Valuation Report for This Property
The Home Valuation Report is an in-depth analysis detailing your home's value as well as a comparison with similar homes in the area
Home Values in the Area
Average Home Value in this Area
Purchase History
| Date | Buyer | Sale Price | Title Company |
|---|---|---|---|
| Leeman William Kelly | -- | Attorney Only | |
| Foreman David W | $90,000 | Cass Co Title Co Inc | |
| Foreman David W | $90,000 | Cass County Title Company |
Source: Public Records
Mortgage History
| Date | Status | Borrower | Loan Amount |
|---|---|---|---|
| Open | Leeman William Kelly | $117,500 |
Source: Public Records
Tax History
| Year | Tax Paid | Tax Assessment Tax Assessment Total Assessment is a certain percentage of the fair market value that is determined by local assessors to be the total taxable value of land and additions on the property. | Land | Improvement |
|---|---|---|---|---|
| 2025 | $5,352 | $193,000 | $20,600 | $172,400 |
| 2024 | $4,950 | $178,400 | $20,600 | $157,800 |
| 2022 | $4,743 | $158,100 | $20,600 | $137,500 |
| 2021 | $3,717 | $123,900 | $20,600 | $103,300 |
| 2020 | $3,417 | $113,900 | $20,600 | $93,300 |
| 2019 | $3,417 | $113,900 | $20,600 | $93,300 |
| 2018 | $3,225 | $107,500 | $20,600 | $86,900 |
| 2017 | $2,817 | $93,900 | $20,600 | $73,300 |
| 2016 | $2,817 | $93,900 | $20,600 | $73,300 |
| 2014 | $2,706 | $90,200 | $20,600 | $69,600 |
| 2013 | $2,706 | $81,800 | $20,600 | $61,200 |
Source: Public Records
Map
Nearby Homes
Your Personal Tour Guide
Ask me questions while you tour the home.