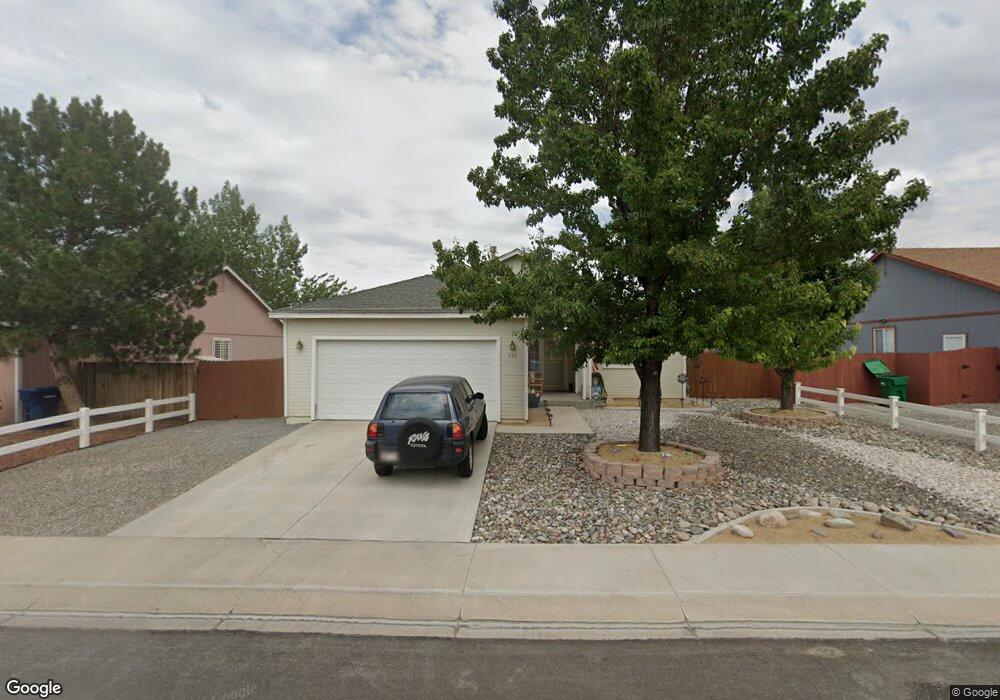
722 Fall St Unit 5 Fernley, NV 89408
Estimated Value: $286,000 - $350,000
3
Beds
2
Baths
1,252
Sq Ft
$263/Sq Ft
Est. Value
About This Home
This home is located at 722 Fall St Unit 5, Fernley, NV 89408 and is currently estimated at $329,632, approximately $263 per square foot. 722 Fall St Unit 5 is a home located in Lyon County with nearby schools including Fernley Elementary School, Fernley Intermediate School, and Fernley High School.
Ownership History
Date
Name
Owned For
Owner Type
Purchase Details
Closed on
Jul 14, 2020
Sold by
Gibbens David G
Bought by
Gibbens David G and The David G Gibbens Trust
Current Estimated Value
Purchase Details
Closed on
May 4, 2011
Sold by
Deutsche Bank National Trust Company
Bought by
Gibbens David George
Purchase Details
Closed on
Feb 11, 2011
Sold by
Schroeder Cody A
Bought by
Deutsche Bank National Trust Company
Purchase Details
Closed on
Mar 22, 2007
Sold by
Deutsche Bank National Trust Co
Bought by
Schroeder Cody A
Home Financials for this Owner
Home Financials are based on the most recent Mortgage that was taken out on this home.
Original Mortgage
$141,750
Interest Rate
6.31%
Mortgage Type
Unknown
Purchase Details
Closed on
Dec 26, 2006
Sold by
Martinez John D
Bought by
Deutsche Bank National Trust Co
Create a Home Valuation Report for This Property
The Home Valuation Report is an in-depth analysis detailing your home's value as well as a comparison with similar homes in the area
Purchase History
| Date | Buyer | Sale Price | Title Company |
|---|---|---|---|
| Gibbens David G | -- | None Available | |
| Gibbens David George | $65,000 | Servicelink | |
| Deutsche Bank National Trust Company | $135,501 | Lsi Title Agency Inc | |
| Schroeder Cody A | $189,000 | First American Title Ins Co | |
| Deutsche Bank National Trust Co | $204,944 | First American Title |
Source: Public Records
Mortgage History
| Date | Status | Borrower | Loan Amount |
|---|---|---|---|
| Previous Owner | Schroeder Cody A | $141,750 |
Source: Public Records
Tax History
| Year | Tax Paid | Tax Assessment Tax Assessment Total Assessment is a certain percentage of the fair market value that is determined by local assessors to be the total taxable value of land and additions on the property. | Land | Improvement |
|---|---|---|---|---|
| 2025 | $1,760 | $94,738 | $42,000 | $52,738 |
| 2024 | $2,039 | $95,149 | $42,000 | $53,148 |
| 2023 | $2,039 | $91,675 | $42,000 | $49,675 |
| 2022 | $1,789 | $87,778 | $42,000 | $45,778 |
| 2021 | $1,713 | $83,167 | $38,500 | $44,667 |
| 2020 | $1,614 | $76,136 | $33,250 | $42,886 |
| 2019 | $1,556 | $67,607 | $26,250 | $41,357 |
| 2018 | $1,506 | $61,347 | $21,000 | $40,347 |
| 2017 | $1,495 | $54,709 | $14,350 | $40,359 |
| 2016 | $1,312 | $40,925 | $5,780 | $35,145 |
| 2015 | $1,348 | $31,557 | $5,780 | $25,777 |
| 2014 | $1,318 | $25,392 | $5,780 | $19,612 |
Source: Public Records
Map
Nearby Homes
Your Personal Tour Guide
Ask me questions while you tour the home.