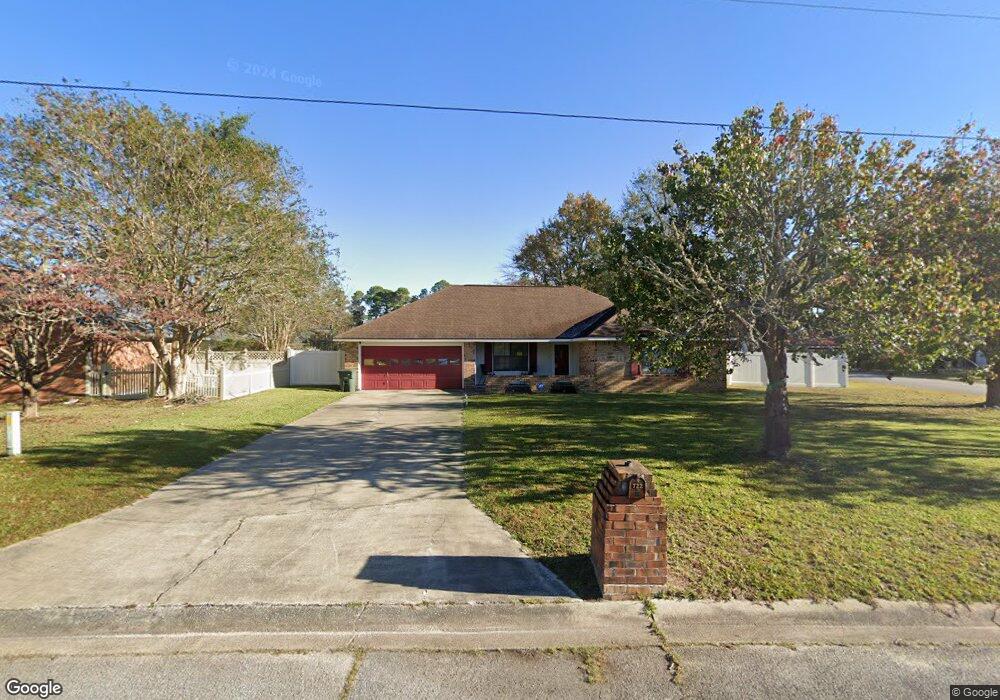
722 Friar Tuck Ln Unit LOT 85,PH 2 Hinesville, GA 31313
Estimated Value: $232,000 - $247,000
3
Beds
2
Baths
1,673
Sq Ft
$145/Sq Ft
Est. Value
About This Home
This home is located at 722 Friar Tuck Ln Unit LOT 85,PH 2, Hinesville, GA 31313 and is currently estimated at $241,840, approximately $144 per square foot. 722 Friar Tuck Ln Unit LOT 85,PH 2 is a home located in Liberty County with nearby schools including Button Gwinnett Elementary School, Snelson-Golden Middle School, and Bradwell Institute.
Ownership History
Date
Name
Owned For
Owner Type
Purchase Details
Closed on
Oct 31, 2022
Sold by
Long Richard D
Bought by
Mckissick Charles E
Current Estimated Value
Purchase Details
Closed on
Dec 10, 2014
Sold by
Freeman Mesahchai Y
Bought by
Long Richard D and Long Athena L
Home Financials for this Owner
Home Financials are based on the most recent Mortgage that was taken out on this home.
Original Mortgage
$127,687
Interest Rate
4.07%
Mortgage Type
VA
Purchase Details
Closed on
Aug 28, 2007
Sold by
Claxton Rupert J
Bought by
Freeman Beauregard and Freeman Mesahchai Y
Home Financials for this Owner
Home Financials are based on the most recent Mortgage that was taken out on this home.
Original Mortgage
$130,950
Interest Rate
6.62%
Mortgage Type
FHA
Purchase Details
Closed on
Nov 9, 1988
Bought by
Claxton Rupert
Create a Home Valuation Report for This Property
The Home Valuation Report is an in-depth analysis detailing your home's value as well as a comparison with similar homes in the area
Home Values in the Area
Average Home Value in this Area
Purchase History
| Date | Buyer | Sale Price | Title Company |
|---|---|---|---|
| Mckissick Charles E | $210,000 | -- | |
| Long Richard D | $125,000 | -- | |
| Freeman Beauregard | $135,000 | -- | |
| Claxton Rupert | $69,900 | -- |
Source: Public Records
Mortgage History
| Date | Status | Borrower | Loan Amount |
|---|---|---|---|
| Previous Owner | Long Richard D | $127,687 | |
| Previous Owner | Freeman Beauregard | $130,950 |
Source: Public Records
Tax History Compared to Growth
Tax History
| Year | Tax Paid | Tax Assessment Tax Assessment Total Assessment is a certain percentage of the fair market value that is determined by local assessors to be the total taxable value of land and additions on the property. | Land | Improvement |
|---|---|---|---|---|
| 2024 | $23 | $83,123 | $14,000 | $69,123 |
| 2023 | $23 | $72,983 | $12,000 | $60,983 |
| 2022 | $2,640 | $56,682 | $9,600 | $47,082 |
| 2021 | $2,449 | $51,579 | $9,600 | $41,979 |
| 2020 | $2,235 | $46,597 | $9,600 | $36,997 |
| 2019 | $2,218 | $46,597 | $9,600 | $36,997 |
| 2018 | $2,229 | $47,090 | $9,600 | $37,490 |
| 2017 | $1,551 | $47,090 | $9,600 | $37,490 |
| 2016 | $2,146 | $47,584 | $9,600 | $37,984 |
| 2015 | $2,061 | $47,584 | $9,600 | $37,984 |
| 2014 | $2,061 | $45,180 | $9,600 | $35,580 |
| 2013 | -- | $50,628 | $9,600 | $41,028 |
Source: Public Records
Map
Nearby Homes
- 731 Robin Hood Dr
- 22 Oak St
- 740 Robin Hood Dr
- 702 Friar Tuck Ln
- 715 Little John Dr
- 664 Demere St
- 614 Demere St
- 615 Scott St
- 668 Windhaven Dr
- 617 Oak St
- 0 County Line Rd Unit 1644022
- 0 County Line Rd Unit 18961791
- 489 Elm St
- 726 Timber Ridge Trail
- 901 Pintail Ct
- 798 Madison Dr
- 703 Tray Ct
- 909 Drake Ct
- 904 Drake Ct
- 722 Friar Tuck Ln
- 720 Friar Tuck Ln
- 735 Robin Hood Dr
- 0 Robin Hood Dr Unit 7472751
- 0 Robin Hood Dr
- 733 Robin Hood Dr
- 718 Friar Tuck Ln
- 754 Robin Hood Dr
- 713 Friar Tuck Ln
- 752 Robin Hood Dr
- 756 Robin Hood Dr
- 750 Robin Hood Dr
- 758 Robin Hood Dr
- 716 Friar Tuck Ln
- 711 Friar Tuck Ln
- 729 Robin Hood Dr
- 714 Friar Tuck Ln
- 760 Robin Hood Dr
- 714 Friar Tuck Ln
- 727 Robin Hood Dr