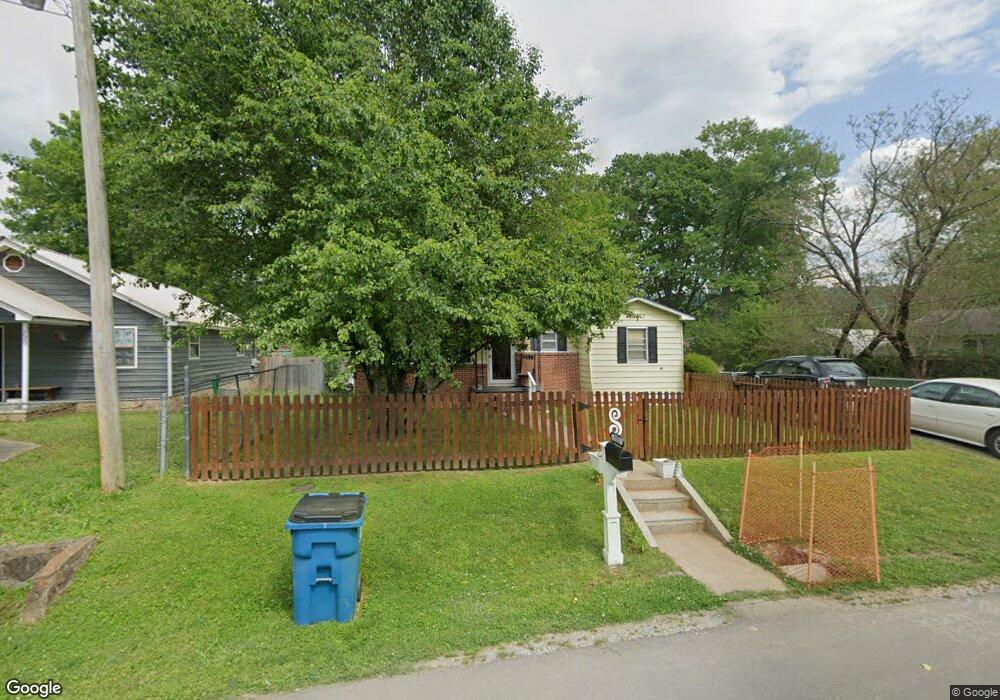
722 Henderson Ave Rossville, GA 30741
Estimated Value: $155,000 - $178,389
3
Beds
1
Bath
960
Sq Ft
$176/Sq Ft
Est. Value
About This Home
This home is located at 722 Henderson Ave, Rossville, GA 30741 and is currently estimated at $168,847, approximately $175 per square foot. 722 Henderson Ave is a home located in Walker County with nearby schools including Rossville Elementary School, Rossville Middle School, and Ridgeland High School.
Ownership History
Date
Name
Owned For
Owner Type
Purchase Details
Closed on
Jun 16, 2005
Sold by
Not Provided
Bought by
Wilkinson Gladys
Current Estimated Value
Purchase Details
Closed on
Jan 2, 1985
Sold by
Secretary Of Housing Urban Dev
Bought by
Pitts Ii Fred M and Fred Pitts I
Purchase Details
Closed on
Aug 20, 1984
Sold by
Federal National Mortgage Ass
Bought by
Secretary Of Housing Urban Dev
Purchase Details
Closed on
Dec 6, 1983
Sold by
Williams David L and Wf Jimmie
Bought by
Federal National Mortgage Ass
Purchase Details
Closed on
Aug 26, 1980
Sold by
Goodman Wm L E and Wf Billie Su
Bought by
Williams David L and Wf Jimmie
Purchase Details
Closed on
Aug 6, 1974
Sold by
Johnson Jerry Allen and Wf Caro
Bought by
Goodman Wm L E and Wf Billie Su
Purchase Details
Closed on
Oct 23, 1969
Bought by
Johnson Jerry Allen and Wf Caro
Create a Home Valuation Report for This Property
The Home Valuation Report is an in-depth analysis detailing your home's value as well as a comparison with similar homes in the area
Home Values in the Area
Average Home Value in this Area
Purchase History
| Date | Buyer | Sale Price | Title Company |
|---|---|---|---|
| Wilkinson Gladys | $48,000 | -- | |
| Pitts Ii Fred M | -- | -- | |
| Secretary Of Housing Urban Dev | -- | -- | |
| Federal National Mortgage Ass | $36,700 | -- | |
| Williams David L | $31,500 | -- | |
| Goodman Wm L E | -- | -- | |
| Johnson Jerry Allen | -- | -- |
Source: Public Records
Tax History Compared to Growth
Tax History
| Year | Tax Paid | Tax Assessment Tax Assessment Total Assessment is a certain percentage of the fair market value that is determined by local assessors to be the total taxable value of land and additions on the property. | Land | Improvement |
|---|---|---|---|---|
| 2024 | $1,999 | $61,220 | $5,760 | $55,460 |
| 2023 | $1,921 | $58,194 | $5,760 | $52,434 |
| 2022 | $991 | $37,630 | $5,760 | $31,870 |
| 2021 | $750 | $25,552 | $5,760 | $19,792 |
| 2020 | $682 | $22,219 | $5,760 | $16,459 |
| 2019 | $682 | $22,219 | $5,760 | $16,459 |
| 2018 | $661 | $22,219 | $5,760 | $16,459 |
| 2017 | $739 | $22,219 | $5,760 | $16,459 |
| 2016 | $460 | $16,680 | $5,760 | $10,920 |
| 2015 | $693 | $23,961 | $5,820 | $18,141 |
| 2014 | $668 | $23,961 | $5,820 | $18,141 |
| 2013 | -- | $23,961 | $5,820 | $18,141 |
Source: Public Records
Map
Nearby Homes
- 1014 Lee Ave
- 816 Indian Ave
- 200 W Oak St
- 916 Logan Ave
- 806 Mcfarland Ave
- 105 Elm St
- 126 S Liner St
- 1204 Wooden Ave
- 115 Beech St
- 4 Carroll Ln
- 527 W Gordon Ave
- 405 Miami Ave
- 509 W Gordon Ave
- 136 Summit St
- Lot 81 Battle Bluff Dr
- Lot 80 Battle Bluff Dr
- Lot 79 Battle Bluff Dr
- 601 James St
- 635 N Sherry Dr
- 53 Charlsie Trail Unit 12
- 720 Henderson Ave
- 726 Henderson Ave
- 723 Carden Ave
- 716 Henderson Ave
- 729 Henderson Ave
- 725 Henderson Ave
- 727 Carden Ave
- 804 Henderson Ave
- 723 Henderson Ave
- 802 Henderson Ave
- 719 Carden Ave
- 714 Henderson Ave
- 901 Carden Ave
- 503 Cherry St
- 717 Carden Ave
- 705 Henderson Ave
- 705 Henderson Ave Unit 1
- 803 Carden Ave
- 715 & 717 Henderson Ave
- 717 Henderson Ave