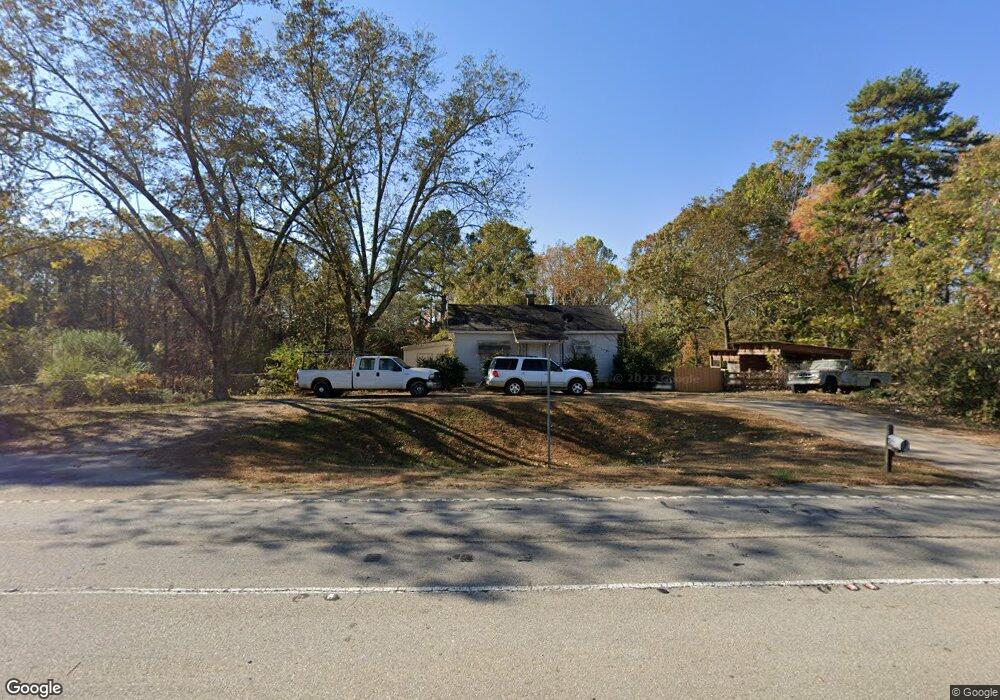
722 Highway 211 NE Winder, GA 30680
Estimated Value: $234,000 - $350,000
--
Bed
2
Baths
1,416
Sq Ft
$216/Sq Ft
Est. Value
About This Home
This home is located at 722 Highway 211 NE, Winder, GA 30680 and is currently estimated at $306,330, approximately $216 per square foot. 722 Highway 211 NE is a home located in Barrow County with nearby schools including Holsenbeck Elementary School, Bear Creek Middle School, and Winder-Barrow High School.
Ownership History
Date
Name
Owned For
Owner Type
Purchase Details
Closed on
Feb 20, 2018
Sold by
Powers Mary
Bought by
Powers Mary and Collins Rose Marie
Current Estimated Value
Purchase Details
Closed on
May 30, 2012
Sold by
Brooks Caryl Evans
Bought by
Powers Mary
Purchase Details
Closed on
Oct 25, 2005
Sold by
Miller Richard H
Bought by
Brooks Caryl E
Purchase Details
Closed on
Oct 25, 2000
Sold by
Lathier Trip
Bought by
Evans Ramon J
Home Financials for this Owner
Home Financials are based on the most recent Mortgage that was taken out on this home.
Original Mortgage
$82,900
Interest Rate
9.75%
Mortgage Type
New Conventional
Purchase Details
Closed on
Jun 9, 2000
Sold by
Contimortgage Corp
Bought by
Oneal Thomas
Purchase Details
Closed on
Mar 7, 2000
Sold by
Brock Chris and Brock Tony
Bought by
Contimortgage Corpor
Purchase Details
Closed on
Mar 31, 1997
Bought by
Brock Chris and Brock Tony
Create a Home Valuation Report for This Property
The Home Valuation Report is an in-depth analysis detailing your home's value as well as a comparison with similar homes in the area
Home Values in the Area
Average Home Value in this Area
Purchase History
| Date | Buyer | Sale Price | Title Company |
|---|---|---|---|
| Powers Mary | -- | -- | |
| Powers Mary | $110,000 | -- | |
| Brooks Caryl E | -- | -- | |
| Evans Ramon J | $92,900 | -- | |
| Oneal Thomas | $52,000 | -- | |
| Contimortgage Corpor | -- | -- | |
| Brock Chris | -- | -- |
Source: Public Records
Mortgage History
| Date | Status | Borrower | Loan Amount |
|---|---|---|---|
| Previous Owner | Evans Ramon J | $82,900 |
Source: Public Records
Tax History Compared to Growth
Tax History
| Year | Tax Paid | Tax Assessment Tax Assessment Total Assessment is a certain percentage of the fair market value that is determined by local assessors to be the total taxable value of land and additions on the property. | Land | Improvement |
|---|---|---|---|---|
| 2024 | $513 | $66,204 | $16,036 | $50,168 |
| 2023 | $382 | $66,204 | $16,036 | $50,168 |
| 2022 | $388 | $47,359 | $16,036 | $31,323 |
| 2021 | $345 | $41,709 | $12,829 | $28,880 |
| 2020 | $334 | $41,636 | $15,200 | $26,436 |
| 2019 | $350 | $41,636 | $15,200 | $26,436 |
| 2018 | $324 | $41,636 | $15,200 | $26,436 |
| 2017 | $1,106 | $37,995 | $15,200 | $22,795 |
| 2016 | $1,171 | $38,249 | $15,200 | $23,049 |
| 2015 | $1,192 | $38,756 | $15,200 | $23,556 |
| 2014 | $998 | $31,258 | $7,448 | $23,810 |
| 2013 | -- | $30,202 | $7,448 | $22,754 |
Source: Public Records
Map
Nearby Homes
- 662 Carla Ct
- 173 Equestrian Walk
- 867 Windward Rd
- 273 Greystone Ct
- 547 Hickeria Way
- 91 Beech Creek Cir
- 508 Pleasant Hill Church Rd NE
- 105 Beech Creek Cir
- 421 Arrowhatchee Dr
- 372 Ashton Way
- 303 Mockingbird Ln Unit 22
- 17 Mockingbird Ln Unit 11
- 88 Mockingbird Ln Unit 37
- 388 Kay Dr Unit 1
- 1311 Calgary Lake Dr
- 1815 Alberta Ln
- 303 Rooks Rd
- 558 Calgary Downs Dr
- 457 Banff Dr
- 560 Calgary Downs Dr
- 722 Highway 211 NE
- 712 Highway 211 NE
- 722 Hwy 211ne
- 716 Highway 211 NE
- 730 NE Hwy 211ne
- 730 Georgia Highway 211
- 730 Highway 211ne NE
- 730 Highway 211 NE
- 730 Hwy 211ne NE
- 713 Highway 211 NE
- 742 Highway 211 NE
- 707 Hwy 211ne
- 739 Highway 211 NE
- 700 Highway 211 NE
- 754 Highway 211 NE
- 374 Dunahoo Rd
- 693 Highway 211 NE
- 414 Dunahoo Rd
- 680 Highway 211 NE
- 478 Dunahoo Rd