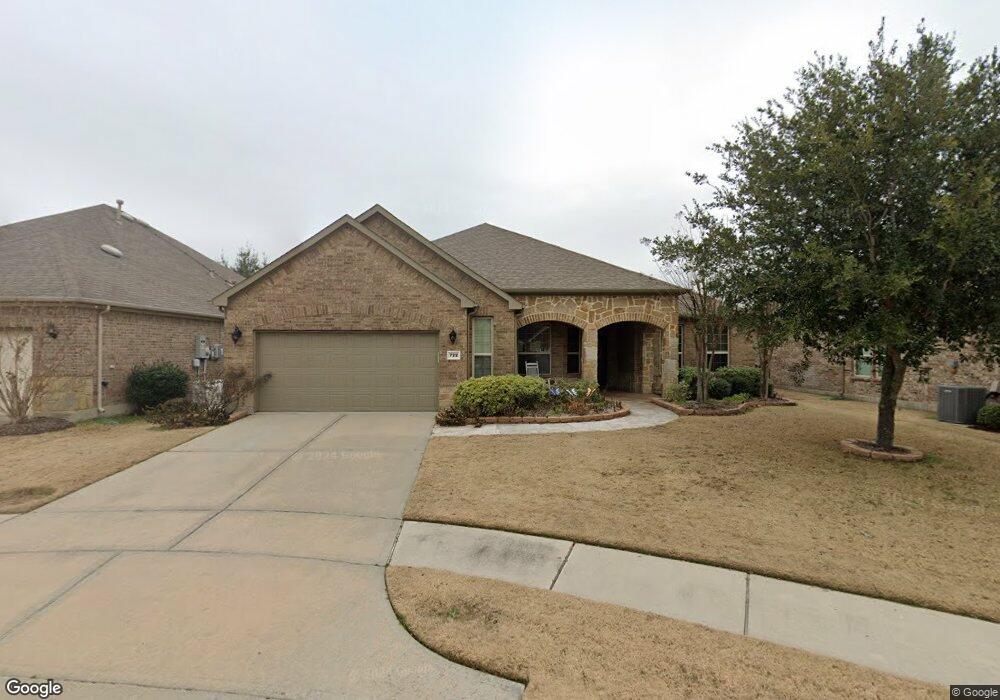
722 Mission Olive Cove Richmond, TX 77469
Estimated Value: $448,756 - $483,000
3
Beds
3
Baths
2,542
Sq Ft
$184/Sq Ft
Est. Value
About This Home
This home is located at 722 Mission Olive Cove, Richmond, TX 77469 and is currently estimated at $467,189, approximately $183 per square foot. 722 Mission Olive Cove is a home located in Fort Bend County with nearby schools including J J Wessendorff Middle School, Lamar Junior High School, and Lamar Consolidated High School.
Ownership History
Date
Name
Owned For
Owner Type
Purchase Details
Closed on
Jul 12, 2019
Sold by
Gaitan Rafael and Gaitan Jacqueline
Bought by
Hurst Charlene
Current Estimated Value
Purchase Details
Closed on
Feb 20, 2014
Sold by
Pulte Homes Of Texas Lp
Bought by
Gaitan Rafaet and Gaitan Jacqueline
Home Financials for this Owner
Home Financials are based on the most recent Mortgage that was taken out on this home.
Original Mortgage
$237,120
Interest Rate
4.55%
Mortgage Type
New Conventional
Purchase Details
Closed on
Jan 24, 2013
Sold by
Cw Richmond Lp
Bought by
Gaitan Rafael and Gaitan Jacqueline
Purchase Details
Closed on
Oct 10, 2012
Sold by
Cw Richmond Lp
Bought by
Gaitan Rafael and Gaitan Jacqueline
Create a Home Valuation Report for This Property
The Home Valuation Report is an in-depth analysis detailing your home's value as well as a comparison with similar homes in the area
Home Values in the Area
Average Home Value in this Area
Purchase History
| Date | Buyer | Sale Price | Title Company |
|---|---|---|---|
| Hurst Charlene | -- | Select Title Llc | |
| Gaitan Rafaet | -- | None Available | |
| Gaitan Rafael | -- | -- | |
| Gaitan Rafael | -- | -- |
Source: Public Records
Mortgage History
| Date | Status | Borrower | Loan Amount |
|---|---|---|---|
| Previous Owner | Gaitan Rafaet | $237,120 |
Source: Public Records
Tax History Compared to Growth
Tax History
| Year | Tax Paid | Tax Assessment Tax Assessment Total Assessment is a certain percentage of the fair market value that is determined by local assessors to be the total taxable value of land and additions on the property. | Land | Improvement |
|---|---|---|---|---|
| 2025 | $7,291 | $467,127 | $68,900 | $398,227 |
| 2024 | $7,291 | $463,091 | $43,978 | $419,113 |
| 2023 | $7,412 | $420,992 | $11,681 | $409,311 |
| 2022 | $10,124 | $382,720 | $41,510 | $341,210 |
| 2021 | $10,281 | $347,930 | $53,000 | $294,930 |
| 2020 | $10,495 | $345,520 | $53,000 | $292,520 |
| 2019 | $10,729 | $331,770 | $53,000 | $278,770 |
| 2018 | $11,457 | $350,470 | $53,000 | $297,470 |
| 2017 | $11,338 | $344,200 | $53,000 | $291,200 |
| 2016 | $10,901 | $330,920 | $53,000 | $277,920 |
| 2015 | $5,284 | $316,560 | $53,000 | $263,560 |
| 2014 | $3,802 | $201,720 | $42,500 | $159,220 |
Source: Public Records
Map
Nearby Homes
- 2918 Persimmon Grove
- 1022 Majestic Oak
- 809 Cardinal Flower Dr
- 2926 Coral Berry Ct
- 2951 Coral Berry Ct
- 24331 Dyer Hill Way
- 2811 Cone Flower Dr
- 6600 Fm 762 Rd
- 24323 Rose Cobbler Dr
- 23814 Pullin Market Dr
- 24351 Dyer Hill Way
- 1311 Hudgins Pass
- 1202 Watercrest Park Ln
- 7034 Glennwick Grove Ln
- 23743 Travers Hill Rd
- 1235 Oxbow Crossing Ln
- 23719 Sweeny Valley Dr
- 1303 Paradise Creek Ln
- 3503 Anchor Cove
- 23714 Sweeny Valley Dr
- 718 Mission Olive Cove
- 726 Mission Olive Cove
- 2806 Wild Olive Way
- 2802 Wild Olive Way
- 714 Mission Olive Cove
- 2810 Wild Olive Way
- 723 Mission Olive Cove
- 710 Mission Olive Cove
- 727 Mission Olive Cove
- 2814 Wild Olive Way
- 731 Mission Olive Cove
- 719 Mission Olive Cove
- 2902 Wild Olive Way
- 715 Mission Olive Cove
- 2906 Wild Olive Way
- 711 Mission Olive Cove
- 2803 Wild Olive Way
- 2807 Wild Olive Way
- 2811 Wild Olive Way
- 2914 Wild Olive Way